A
B
C
D
Text Solution
Verified by Experts
The correct Answer is:


Recommended Questions
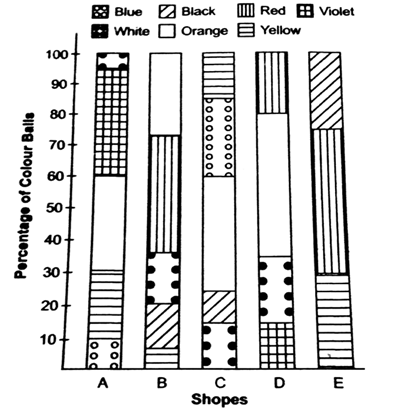
- In the following questions, the followIng Bar Diagram shows the percen...
Text Solution
|
- The inequation that best describes the following graph is <img src="h...
Text Solution
|
- The following bar graph shows the total number of students (Boys+Girls...
Text Solution
|
- In the following questions, the followIng Bar Diagram shows the percen...
Text Solution
|
- In the following questions, the followIng Bar Diagram shows the percen...
Text Solution
|
- In the following questions, the followIng Bar Diagram shows the percen...
Text Solution
|
- In the following questions, the followIng Bar Diagram shows the percen...
Text Solution
|
- In the following questions, the followIng Bar Diagram shows the percen...
Text Solution
|
- Observe the following graph and answer the question : (##NAVMATVIII...
Text Solution
|