Text Solution
Verified by Experts
The correct Answer is:


Topper's Solved these Questions
STATISTICS
NCERT GUJARATI|Exercise Exercise 14.2|6 VideosSTATISTICS
NCERT GUJARATI|Exercise Exercise 14.3|7 VideosSTATISTICS
NCERT GUJARATI|Exercise THINK AND DISCUSS|8 VideosSIMILAR TRIANGLES
NCERT GUJARATI|Exercise TRY THIS|6 VideosTANGENTS AND SECANTS TO A CIRCLE
NCERT GUJARATI|Exercise Try this|2 Videos
Similar Questions
Explore conceptually related problems
NCERT GUJARATI-STATISTICS-Exercise 14.1
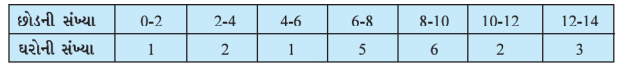
- A survey conducted by a group of students as a part of their environme...
Text Solution
|
- Consider the following distribution of daily wages of 50 workers of a ...
Text Solution
|
- The following distribution shows the daily pocket allowance of childre...
Text Solution
|
- Thirty women were examined in a hospital by a doctor and their heart b...
Text Solution
|
- In a retail market, fruit vendors were selling oranges kept in packing...
Text Solution
|
- The table below the daily expenditure on food of 25 household in a loc...
Text Solution
|
- To find out the concentration of SO(2) in the air (in parts per millio...
Text Solution
|
- A class teacher has the following attendence record of 40 students of ...
Text Solution
|
- The following table gives the literacy rate (in percentage) of 35 citi...
Text Solution
|