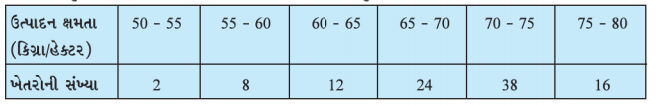
The following table gives production yield per hectare of wheat of 100 farms of a village. Change the distribution to a more than type distribution , and draw its ogive.
Text Solution
Verified by Experts
The correct Answer is:
`(##NCERT_GUJ_MAT_X_C14_E04_003_A01##)` Now, draw the ogive by plotting the points : (50, 100), (55, 98), (60, 90), (65, 78), (70, 54) and (75, 16).
Topper's Solved these Questions
STATISTICS
NCERT GUJARATI|Exercise Do this|3 Videos
STATISTICS
NCERT GUJARATI|Exercise THINK AND DISCUSS|8 Videos
STATISTICS
NCERT GUJARATI|Exercise Exercise 14.3|7 Videos
SIMILAR TRIANGLES
NCERT GUJARATI|Exercise TRY THIS|6 Videos
TANGENTS AND SECANTS TO A CIRCLE
NCERT GUJARATI|Exercise Try this|2 Videos
Similar Questions
Explore conceptually related problems
The following distribution gives the daily income of 50 workers of a factory. Convert the distribution above to a less than type cumulative frequency distribution, and drawn its ogive.
A study was conducted to find out the concentration of sulphur dioxide in the air in parts per million (ppm) of a certain city. The data obtained for 30 days is as follows: (i) Make a grouped frequency distribution table for this data with class intervals as 0.00 -0.04, 0.04 -0.08, and so on. (ii) For how many days, was the concentration of sulphur dioxide more than 0.11 parts per million ?
Find the mean and standard deviation for the following frequency distribution: The follwing table gives the income of 100 families . Find the variance for the data.
I.Q.s of 100 students are given in the following less than type cumulative frequency distrbution : {:(" I.Q. ","Number of students "),("Less than 110 "," "0),("Less than 120 "," "10),("Less than 130 "," "29),("Less than 140 "," "64),("Less than 150 "," "78),("Less than 160 "," "90),("Less than 170 "," "100):} Obtain the cumulative frequency distribution of more than type for the data.
Given below is a frequency distribution of daily income of 100 workers of a factory : {:("Daily income of workers (in ₹) ","Number of workers "),(" "200-300," "12),(" "300-400," "18),(" "400-500," "35),(" "500-600," "20),(" "600-700," "15):} Convert this distribution to cumulative frequency distribution of more than type and less than type