


Topper's Solved these Questions
Similar Questions
Explore conceptually related problems
NCERT GUJARATI-STATISTICS-Miscellaneous Exercise On Chapter 15
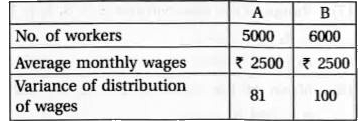
- Two plant A and B of a factory show following results about the number...
Text Solution
|
- The mean and variance of eight observation are 9 and 9.25, respectivel...
Text Solution
|
- The mean and variance of 7 observation are 8 and 16, respectively. If ...
Text Solution
|
- The mean and standard deviation of six observations are 8 and 4, respe...
Text Solution
|
- Given that bar(x) is the mean and sigma^(2) is the variance of n obser...
Text Solution
|
- The mean and standard deviation of 20 observations are found to be 10 ...
Text Solution
|
- The mean and standard deviation of marks obtained by 50 students of a ...
Text Solution
|
- The mean and standard deviation of a group of 100 observations were fo...
Text Solution
|