Home
Class 11
PHYSICS
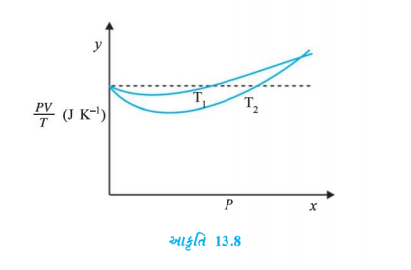
Figure Show plot of PV//T versus P for 1...

Figure Show plot of `PV//T` versus P for `1.00xx10^(-3)` kg of oxygen gas at two different temperatures.

(a) What does the dotted plot signify?
(b) Which is true: `T_(1) gt T_(2)` or `T_(1) lt T_(2)`?
(c) What is the value of `PV//T` where the curves meet on the y-axis?
(d) If we obtained similar plots for `1.00xx10^(-3)` kg of hydrogen, would we get the same value of `PV//T` at the point where the curves meet on the y-axis? If not, what mass of hydrogen yields the same value of `PV//T` (for low pressure high temperature region of the plot) ? (Molecular mass of `H_(2) = 2.02 u, of O_(2) = 32.0 u, R= 8.31Jmol^(-1)K^(-1).)

Text Solution

Verified by Experts

(a) The dotted plot corresponds to .ideal gas behaviour, (b) `T_(1) gt T_(2)`: (c) `0.26 J K^(-1)`, (d) No, `6.3 xx 10^(-5)` kg of `H_(2)` would yield the same value
Promotional Banner

Topper's Solved these Questions

  • KINETIC THEORY

    NCERT GUJARATI|Exercise ADDITIONAL EXERCISE|4 Videos
  • KINETIC THEORY

    NCERT GUJARATI|Exercise ADDITIONAL EXERCISE|4 Videos
  • GRAVITATION

    NCERT GUJARATI|Exercise ADDITIONAL EXERCISES|4 Videos
  • LAW OF MOTION

    NCERT GUJARATI|Exercise EXERCISE (ADDITIONAL EXERCISE)|17 Videos

Similar Questions

Explore conceptually related problems

Calculate a, T_(1), T_(2), T_(1)' & T_(2)' .

In the given figure if T_(1)=2T_(2) = 50 N then find the value of T.

Figure shows graphs of pressure vs density for an ideal gas at two temperature T_(1) and T_(2) . Which of the following is correct ?

Figure shows the isotherms of fixed mass of an ideal gas at three temperatures T_(A), T_(B) and T_(C) then.

The voltage - current (V-1) graphs for a metallic conductor at two different temperatures T_1 and T_2 are shown below: At which temperature is the resistance higher?

At temperature T_(1) , the equilibrium constant of eaction is K_(1) . At a higher temperature T_(2),K_(2) is 10% of K_(1) . Predict whether the equilibrium is endothermic or exothermic.

A curve is represented paramtrically by the equations x=e^(t)cost and y=e^(t)sint where t is a parameter. Then The value of (d^(2)y)/(dx^(2)) at the point where t=0 is

Assertion : Current versus potential difference (i-V) graph for a conductor at two different temperatures T_(1) and T_(2) is shown in figure. Hence T_(1)gt T_(2) . Reason : Resistance of a conductor increases with rise in temperature.