


Similar Questions
Explore conceptually related problems
Recommended Questions
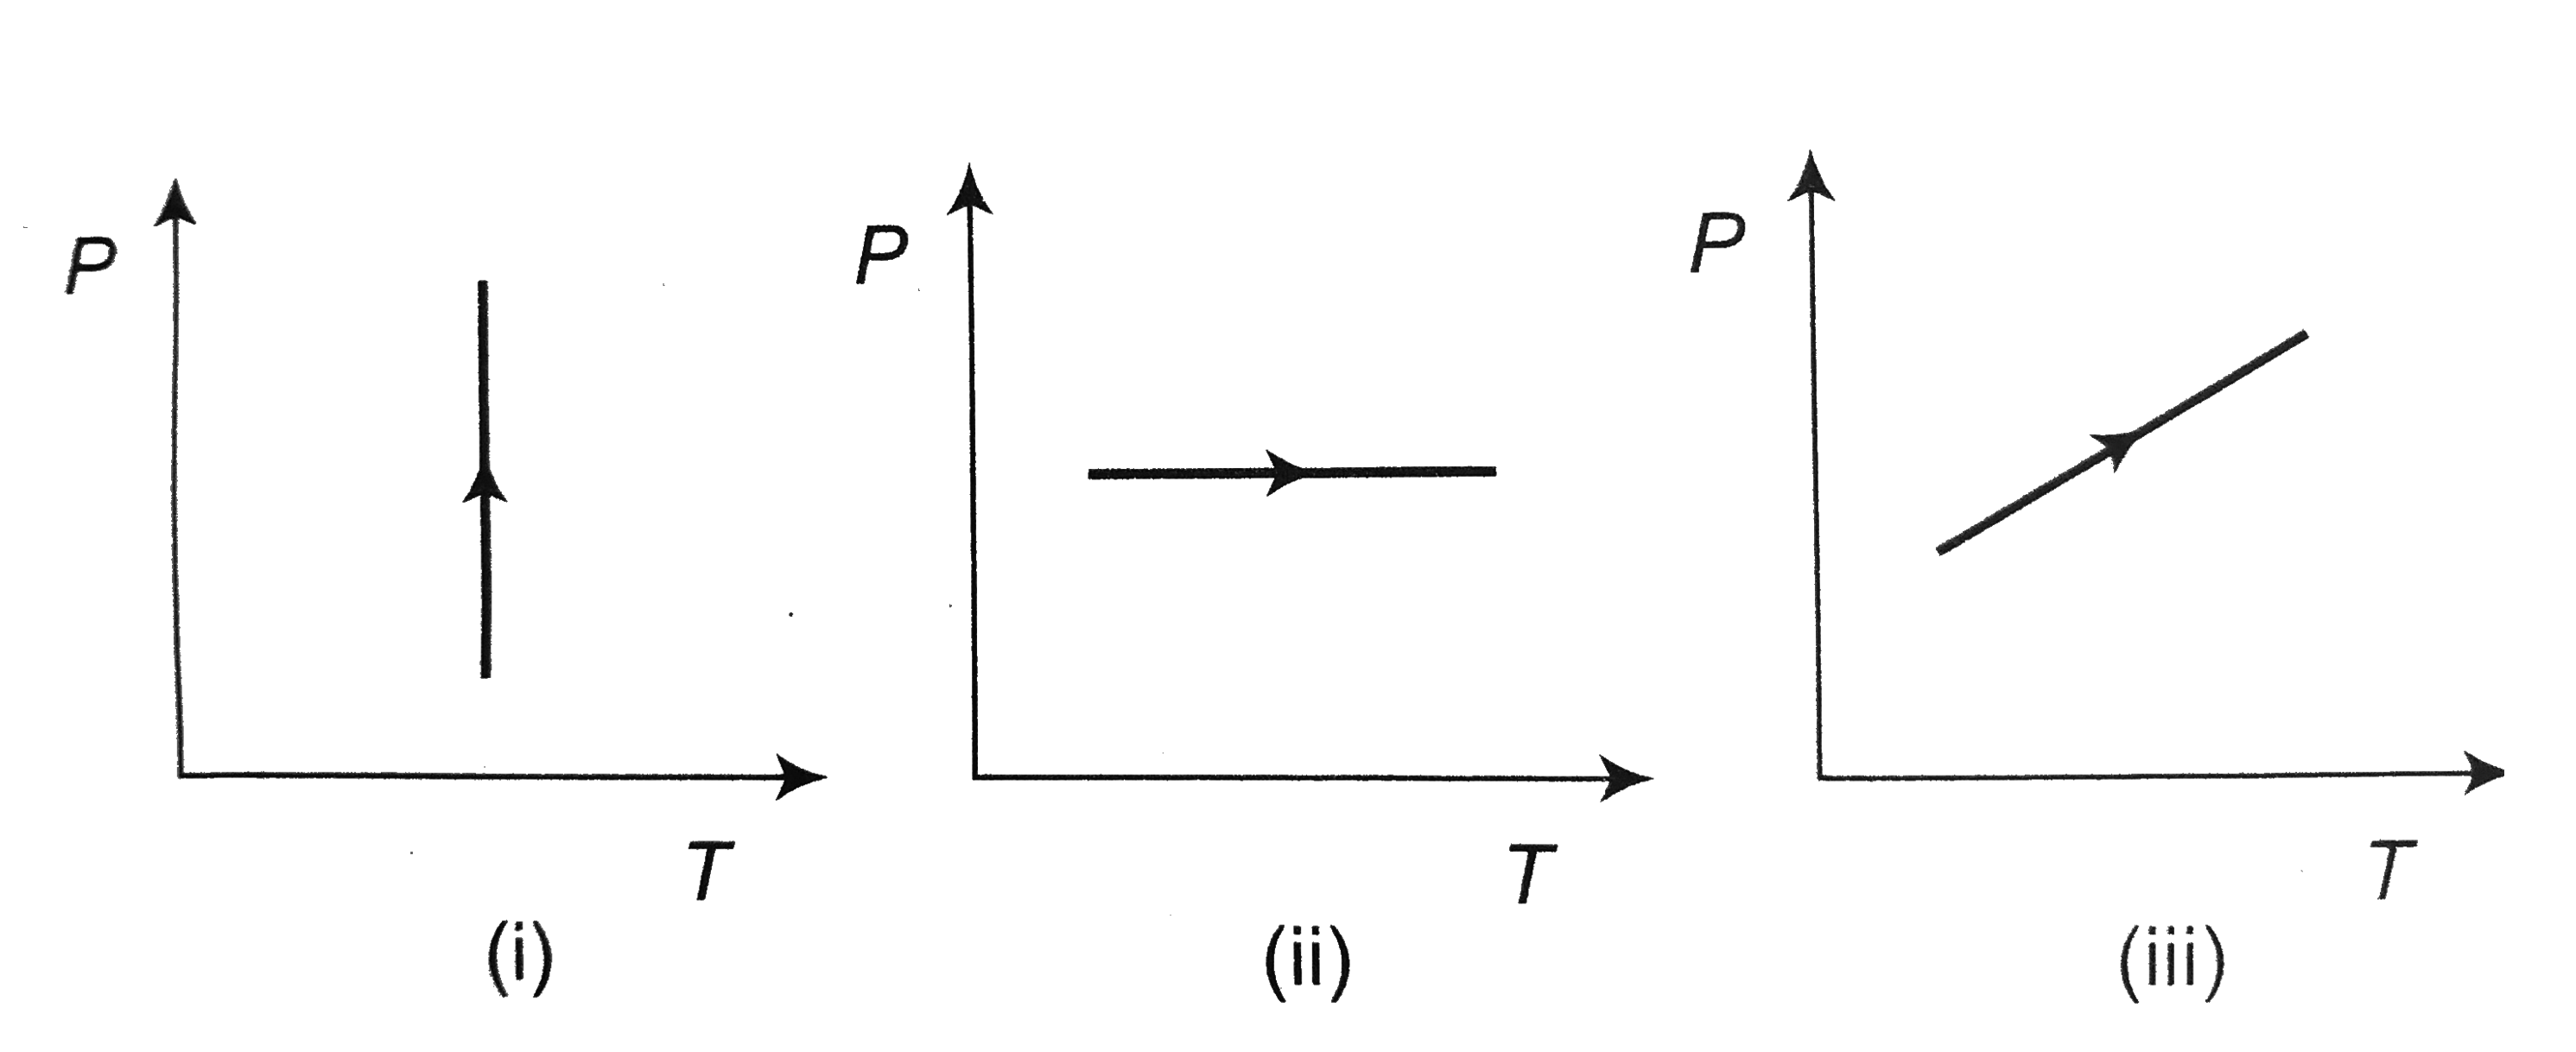
- Pressure versus temperature graphs of an ideal gas are as shown in fig...
Text Solution
|
- Pressure versus temperature graph of an ideal gas as shown in Fig. Cor...
Text Solution
|
- Pressure versus temperature graphs of an ideal gas are as shown in fig...
Text Solution
|
- Pressure versus temperature graph of an ideal gas is shown in figure. ...
Text Solution
|
- Pressure versus temperature graph of an ideal gas of equal number of m...
Text Solution
|
- Pressure versus density graph of an ideal gas is shown in figure
Text Solution
|
- Pressure versus temperature graph of an ideal gas are as shown in figu...
Text Solution
|
- Pressure versus temperature graph of an ideal gas is as shown in figur...
Text Solution
|
- Pressure versus temperature graph of an ideal gas is as shown in figur...
Text Solution
|