


Similar Questions
Explore conceptually related problems
Recommended Questions
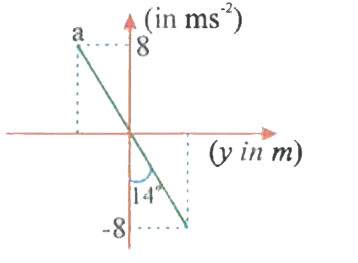
- The acceleration-displacement graph of a particle executing SHM is as ...
Text Solution
|
- A particle executes SHM. Then the graph of velocity as a function of d...
Text Solution
|
- A particle is executing SHM. Then the graph of acceleration as a funct...
Text Solution
|
- A particle is executing SHM. Then the graph of velocity as a function ...
Text Solution
|
- Acceleration-displacement graph of a particle executing SHM Is as show...
Text Solution
|
- Displacement-time graph of a particle executing SHM is as shown T...
Text Solution
|
- displacement versus time curve for a particle executing SHM is is as s...
Text Solution
|
- The displacement - time graph of a particle executing SHM is as shown ...
Text Solution
|
- The displacement time graph of a particle executing SHM is as shown in...
Text Solution
|