


Similar Questions
Explore conceptually related problems
Recommended Questions
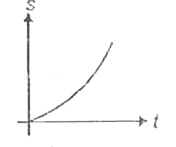
- A : The displacement (s) time graph shown in the figure represents an ...
Text Solution
|
- The displacement-time graph of a body is shown in. . The velocity-...
Text Solution
|
- The acceleration displacement graph of a particle executing simple har...
Text Solution
|
- The displacement-time graph of a body is shown in the figure below. Th...
Text Solution
|
- Graphs are very useful to represent a physical situation. Various quan...
Text Solution
|
- Graphs are very useful to represent a physical situation. Various quan...
Text Solution
|
- Graphs are very useful to represent a physical situation. Various quan...
Text Solution
|
- Graphs are very useful to represent a physical situation. Various quan...
Text Solution
|
- A : The displacement (s) time graph shown in the figure represents an ...
Text Solution
|