


Similar Questions
Explore conceptually related problems
Recommended Questions
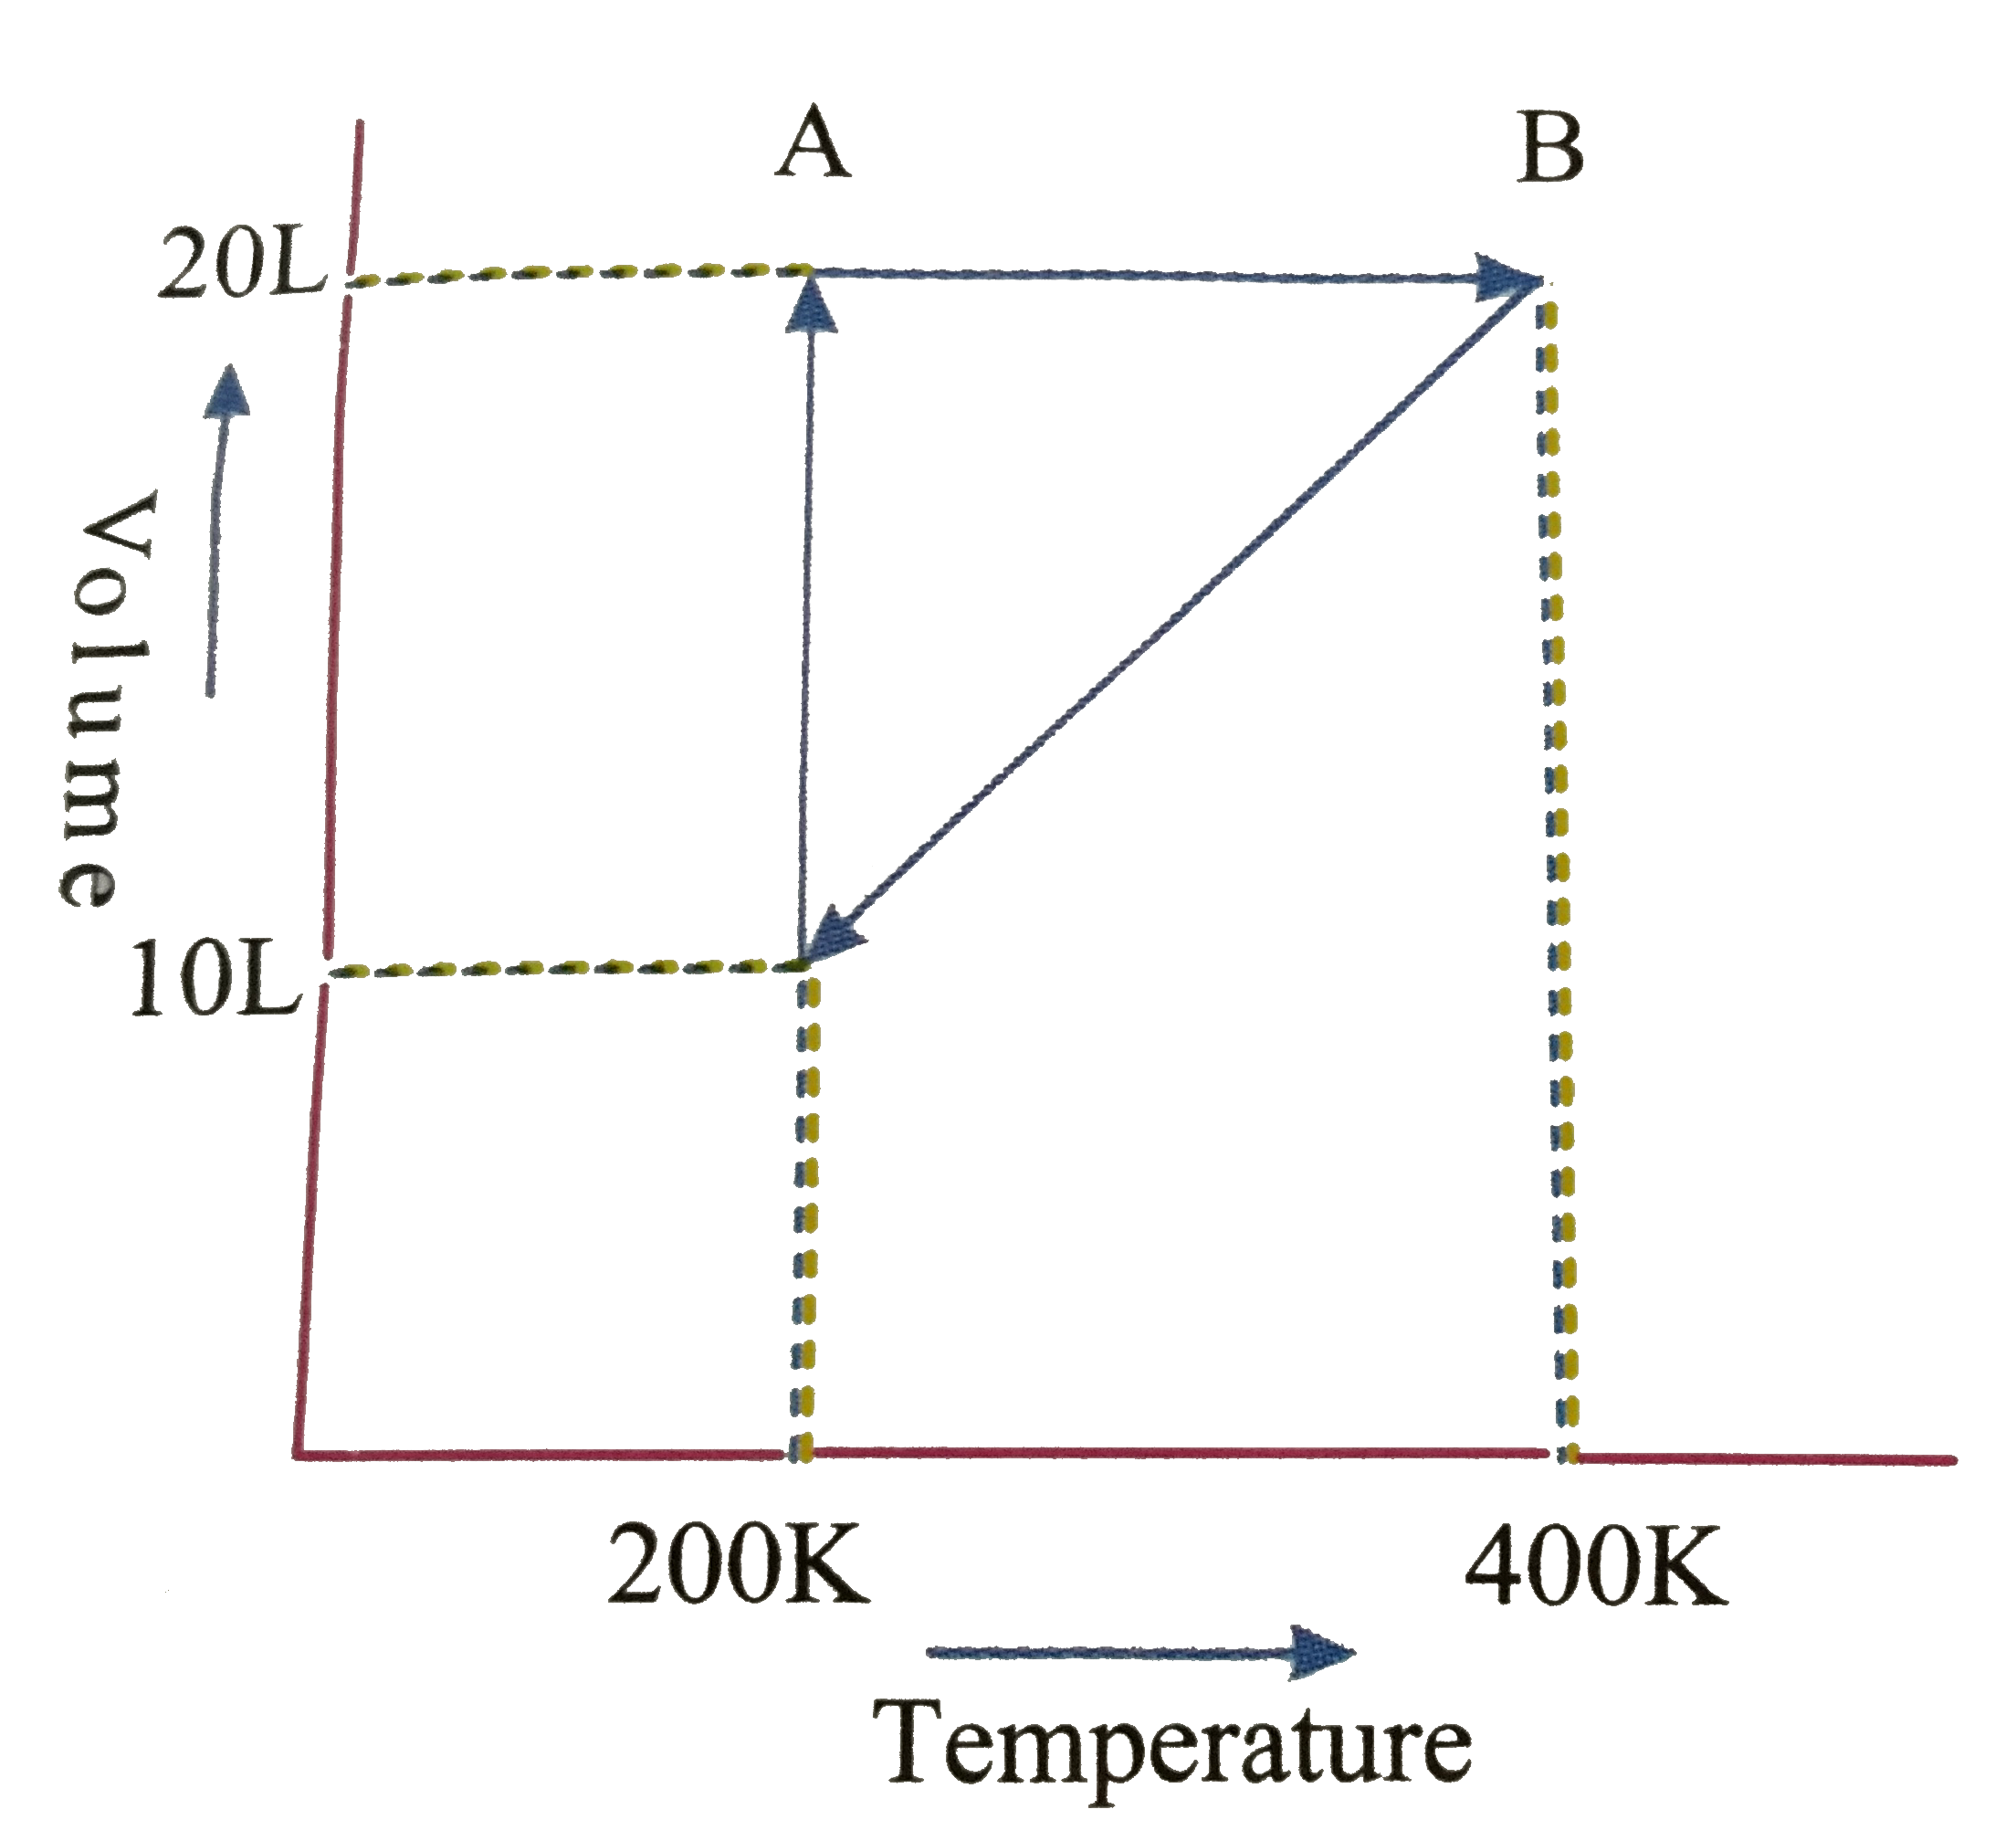
- Graph for one mole gas is given below Process, A rarr B represent...
Text Solution
|
- Process A rarr B represents
Text Solution
|
- One mole of an ideal gas is taken along the process in which PV' = co...
Text Solution
|
- Five mole of a gas put through a series of change as shown below graph...
Text Solution
|
- Graph for one mole gas is given below Process, A rarr B represent...
Text Solution
|
- Graph for one mole gas is given below The pressure at C is
Text Solution
|
- Graph for one mole gas is given below Work done in the process C rarr ...
Text Solution
|
- Graph for one mole gas is given below the process which occurs in...
Text Solution
|
- Five moles of gas is put through a series of changes as shown graphica...
Text Solution
|