Text Solution
Verified by Experts


Topper's Solved these Questions
Similar Questions
Explore conceptually related problems
XII BOARDS PREVIOUS YEAR-XII BOARDS-SECTION - B
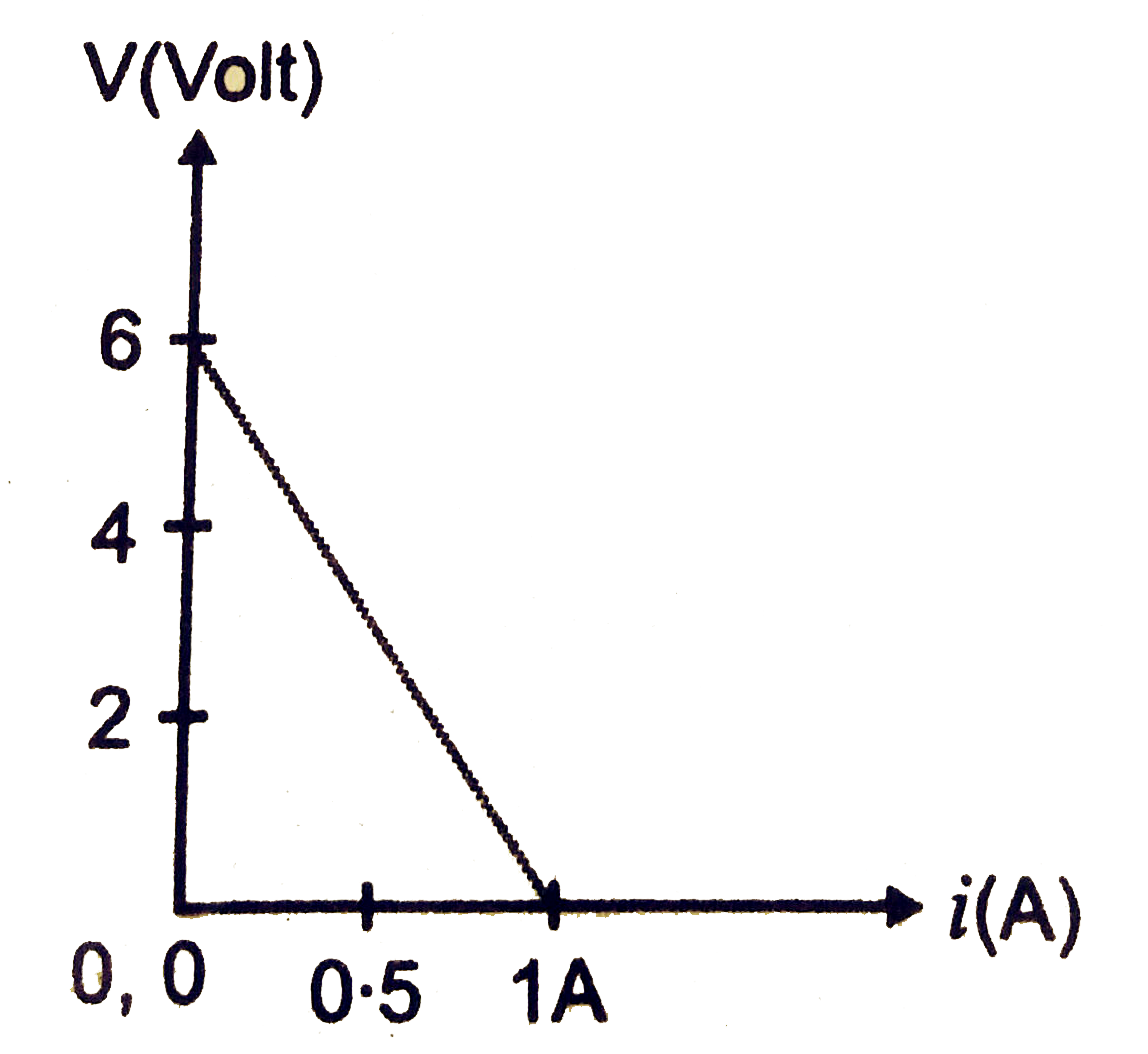
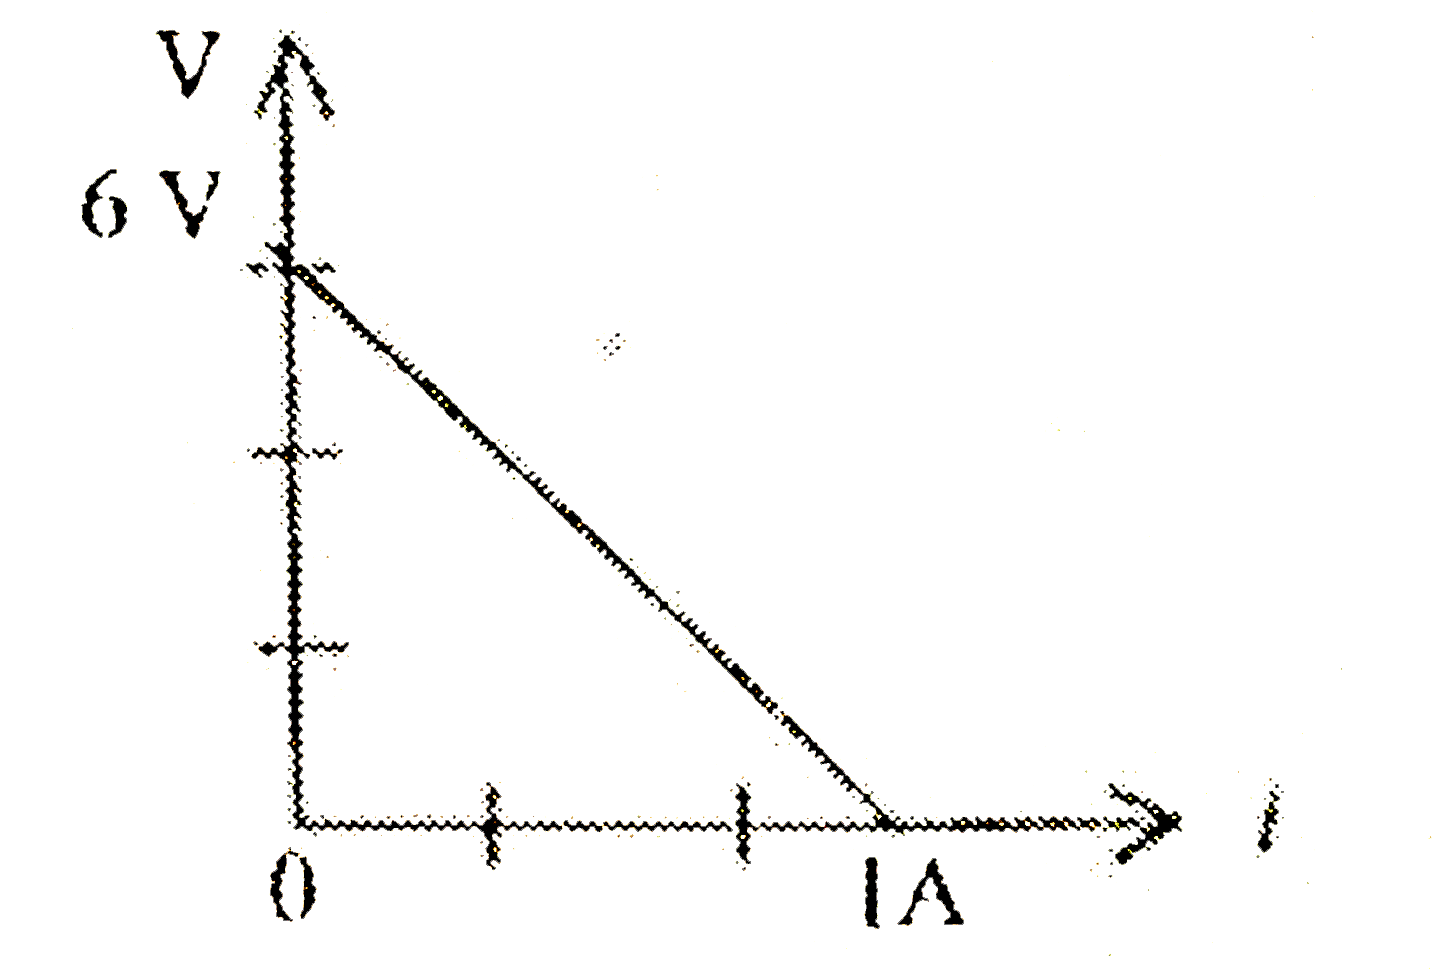
- The plot of the variation of potential difference across a combination...
Text Solution
|
- Using Gauss's law obtain the expression for the electric field due to ...
Text Solution
|
- Two large parallel plane sheets have uniform charge densities + sigma ...
Text Solution
|
- A long straight wire AB carries a current of 4 A. A proton P travels a...
Text Solution
|
- A capacitor, made of two parallel plates each of plate area A and sepa...
Text Solution
|
- A beam of light converges at a point P. Now a convex lens is placed in...
Text Solution
|
- An object is kept in front of a concave mirror of focal length 15 cm. ...
Text Solution
|
- Explain giving reason, how the resolving power of a compound microscop...
Text Solution
|
- The figure shows a modified Young's double slit experimental set-up. ...
Text Solution
|
- A certain n-p-n transistor has the common emitter output characteristi...
Text Solution
|