Text Solution
Verified by Experts


Topper's Solved these Questions
Similar Questions
Explore conceptually related problems
XII BOARDS PREVIOUS YEAR-XII BOARDS-section A
- Define self-inductance of a coil . Write its S.I. units ?
Text Solution
|
- Why does the bluish colour predominate in a clear sky?
Text Solution
|
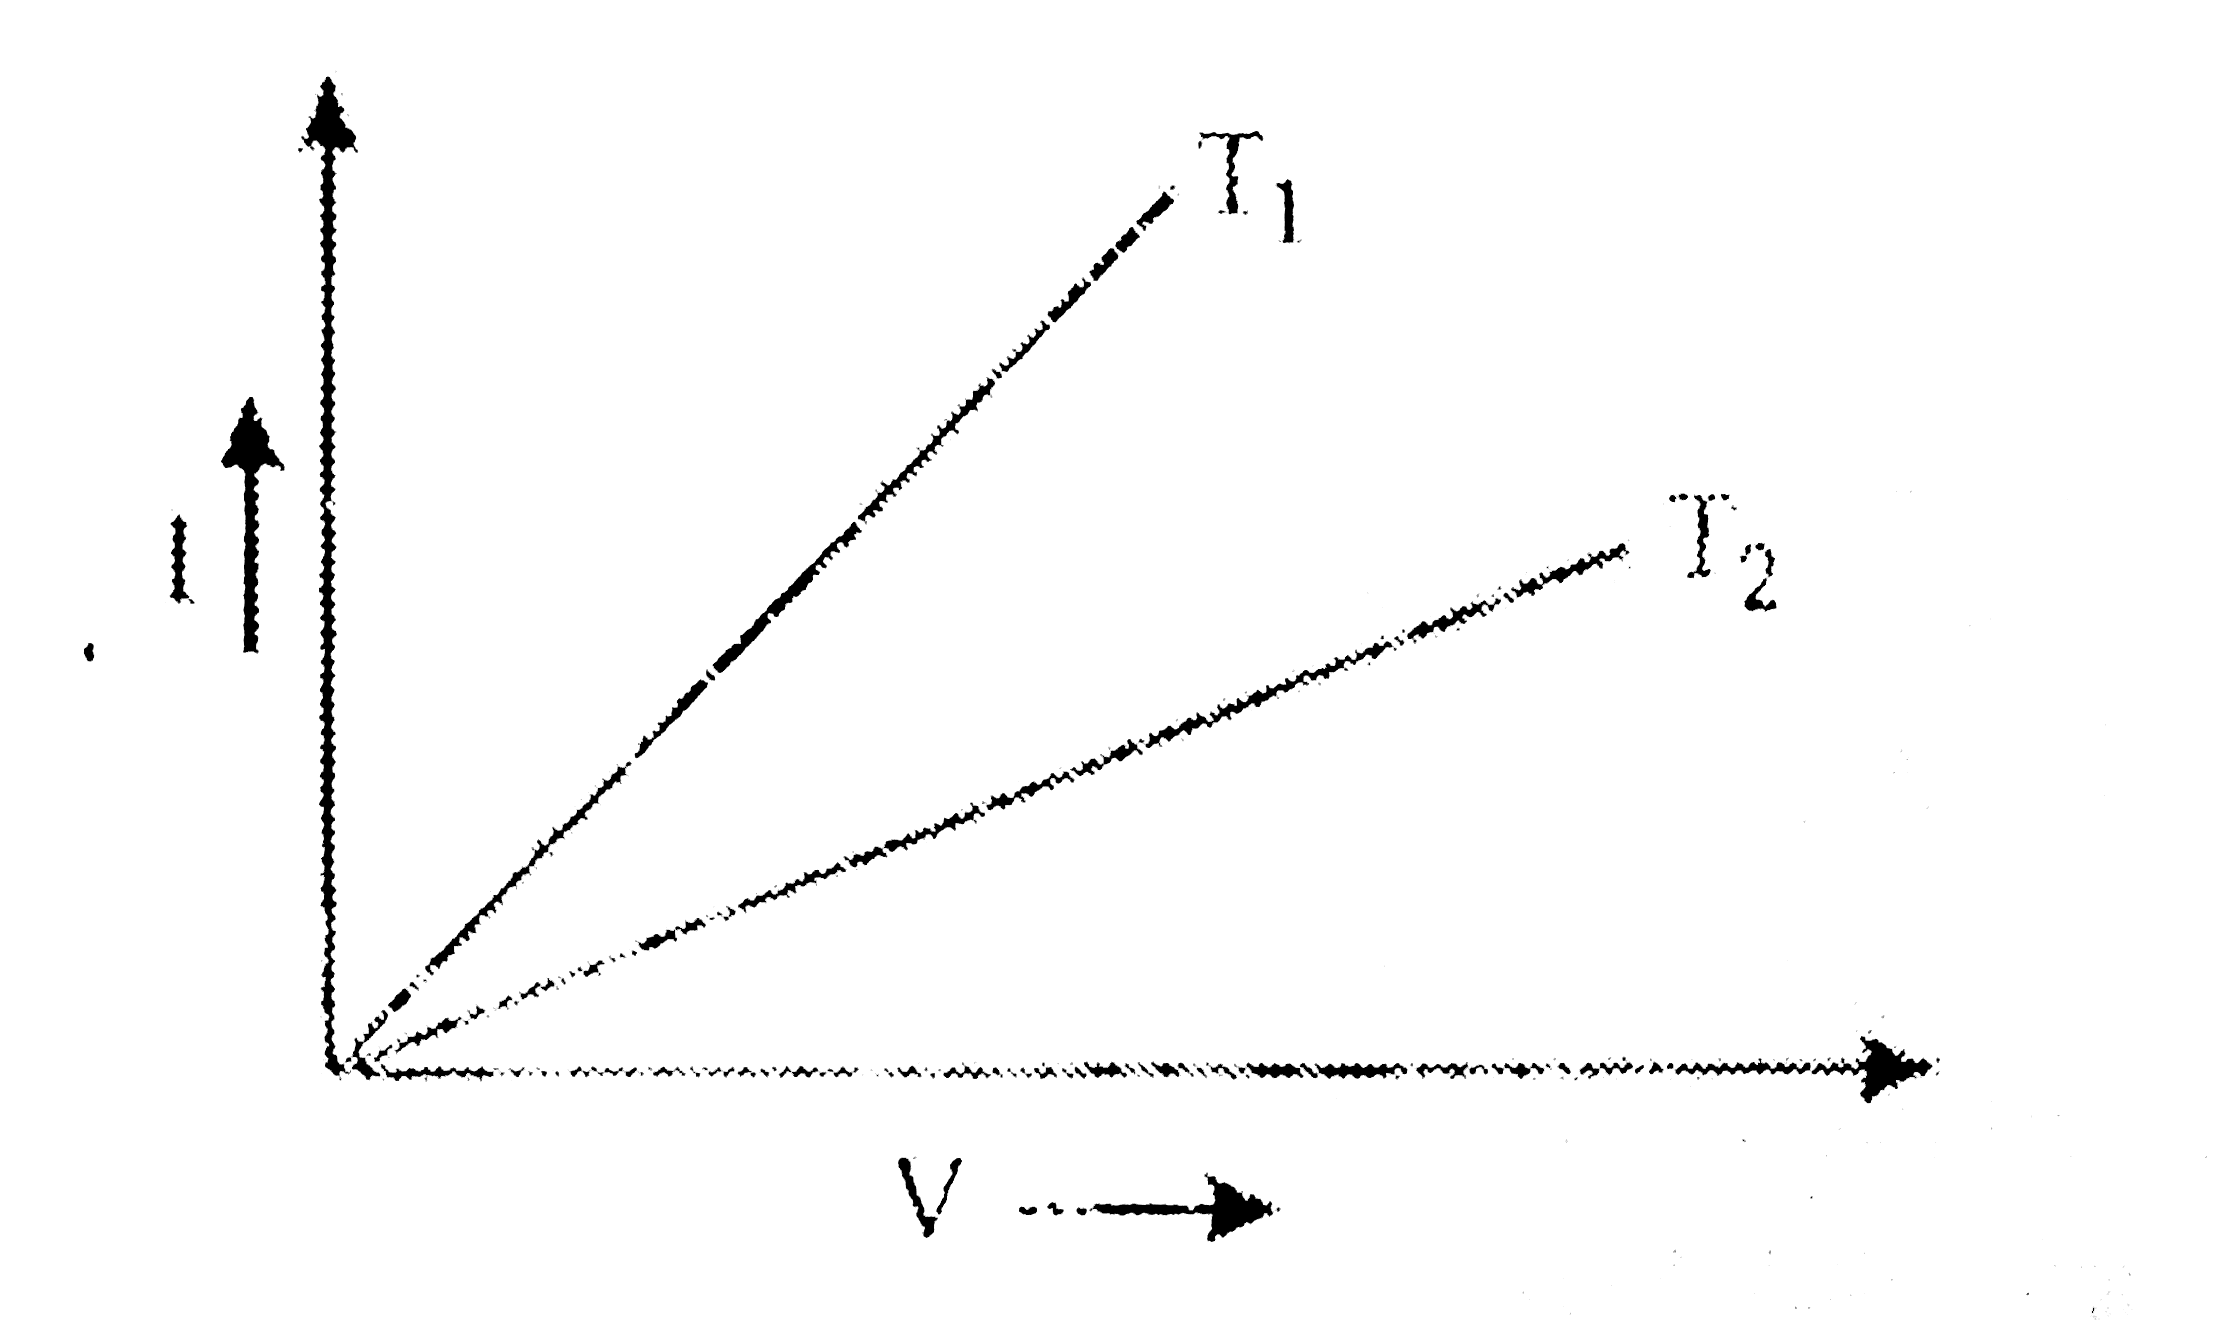
- I-V graph for a metallie wire at two different tempearture, T(1)and T(...
Text Solution
|
- Name the two basic modes of communication. Which one is used for tele...
Text Solution
|
- Why do the electrostatic field lines not form closed loops ?
Text Solution
|