Text Solution
Verified by Experts


Similar Questions
Explore conceptually related problems
Recommended Questions
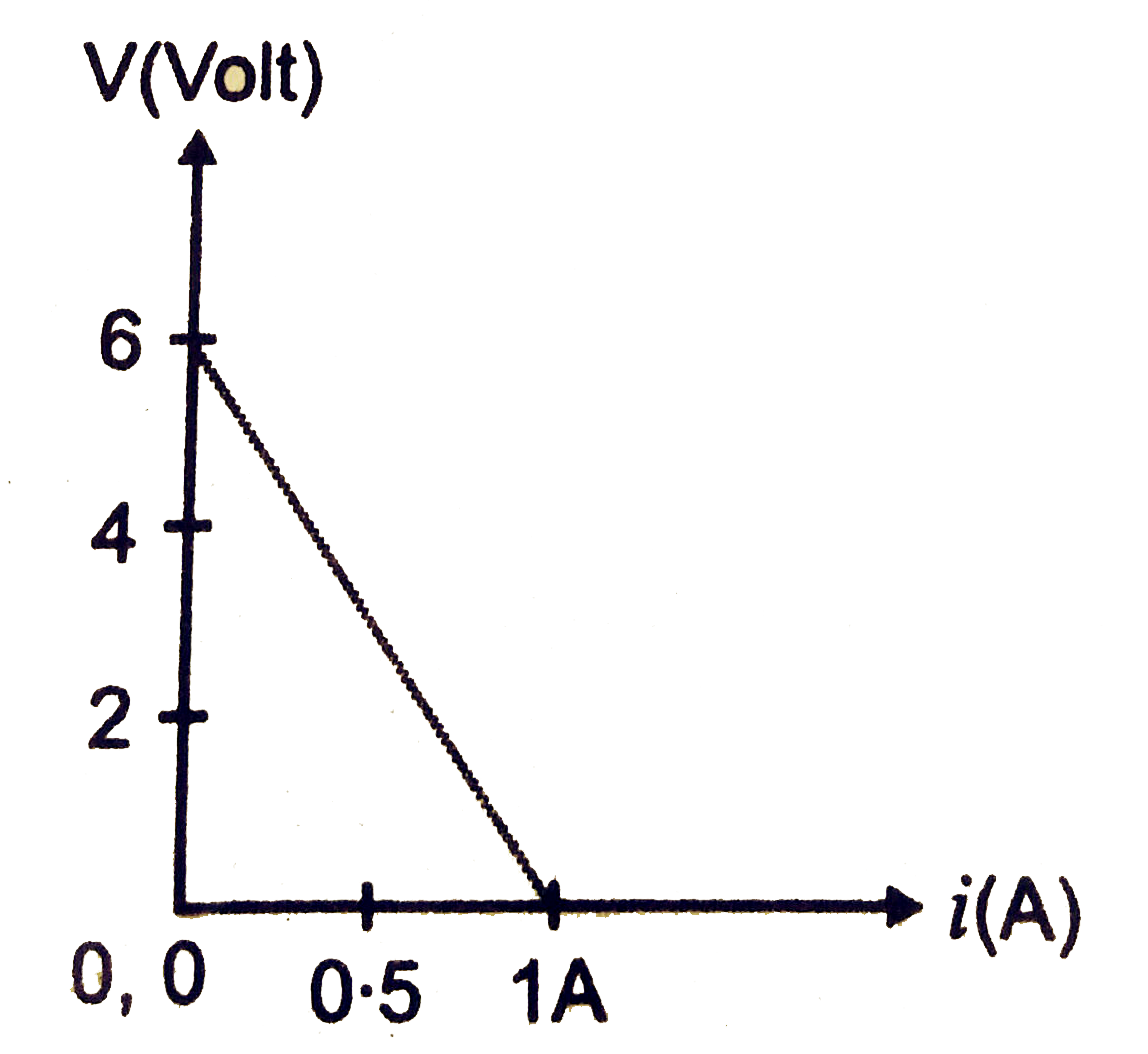
- The plot of the variation of potential difference across a combination...
Text Solution
|
- The plot of the variation of potential difference across a combination...
Text Solution
|
- Three identical cells each of emf 2 V and unknown internal resistance ...
Text Solution
|
- In a network as shown in the figure the potential difference across th...
Text Solution
|
- A series combination of n identical cells has two cells P and Q with r...
Text Solution
|
- .A cell of emf E and internal resistance r is connected across a varia...
Text Solution
|
- The variation of terminal potential difference (V) with current flowin...
Text Solution
|
- The plot of the variation of potential difference across a combination...
Text Solution
|
- The plot of the variation of potential difference across a combination...
Text Solution
|