Text Solution
Verified by Experts


Similar Questions
Explore conceptually related problems
Recommended Questions
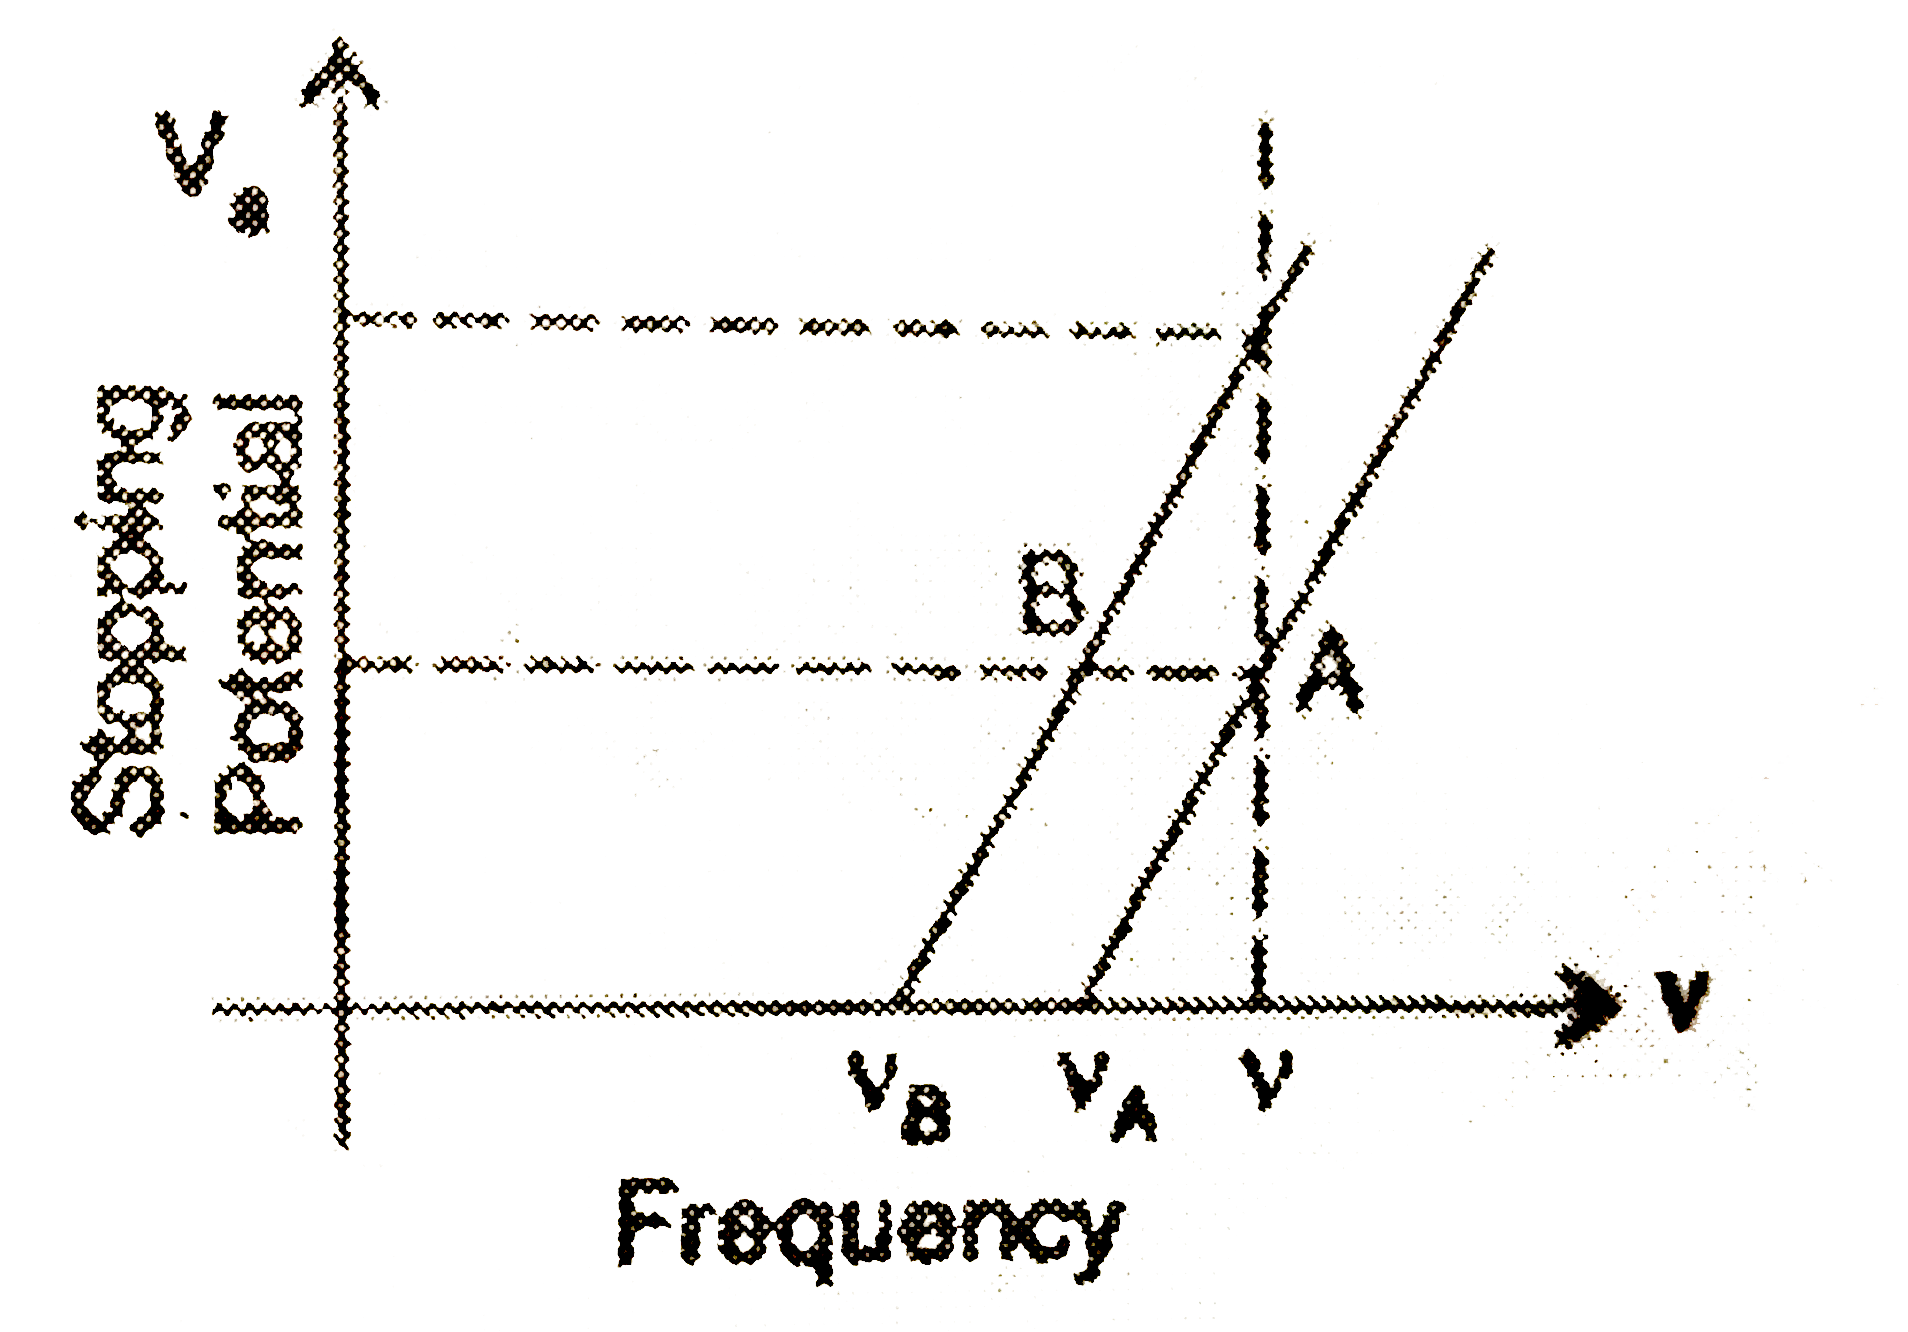
- Sketch the graphs, showing the variation of stopping potential Vs with...
Text Solution
|
- The stopping potential as a function of the frequency of the incident ...
Text Solution
|
- Draw a graph showing the variation of stopping potential with frequenc...
Text Solution
|
- Sketch the graphs, showing the variation of stopping potential Vs with...
Text Solution
|
- The graph shows variation of stopping potential V(0) versus frequency ...
Text Solution
|
- दो प्रकाश संवेदी पदार्थो A व B पर आपतित विकिरण की आवृत्ति तथा विरोधी व...
Text Solution
|
- देहली आवृतियों v(A) gt v(B) के दो प्रकाश सुग्राही पदार्थों A और B के आ...
Text Solution
|
- The graph shows the variation of stopping potential with frequency of ...
Text Solution
|
- The graph between frequency of incident radiations and stopping potent...
Text Solution
|