Text Solution
Verified by Experts


Similar Questions
Explore conceptually related problems
Recommended Questions
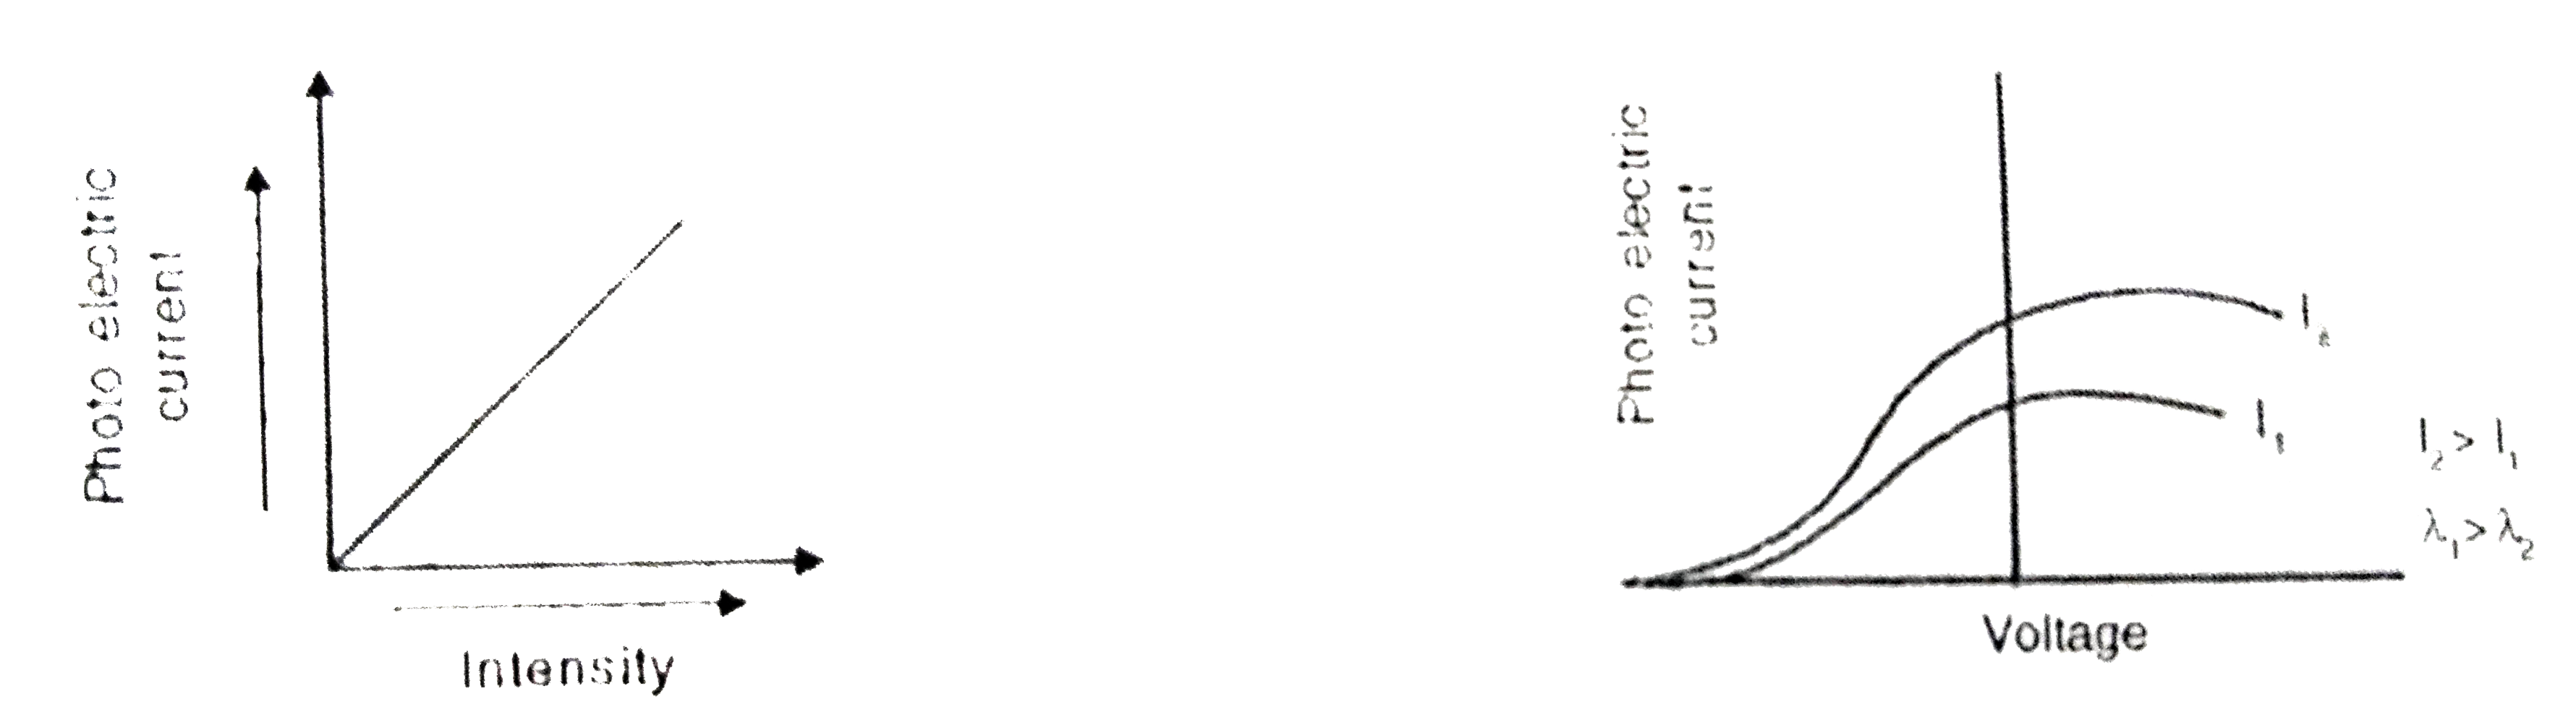
- Darw graphs showing variation of photoelctric current with applied ...
Text Solution
|
- The graph of Fig. shows the variation of photoelectric current (I) ver...
Text Solution
|
- Plot a graph showing the variation of photoelectric current with anode...
Text Solution
|
- Darw graphs showing variation of photoelctric current with applied vol...
Text Solution
|
- Which of the following graphs represents correctly the variations of 0...
Text Solution
|
- Draw graphs showing variation of photoelectric current with applied vo...
Text Solution
|
- प्रकाश संवेदी सतह पर आपतित विकिरण की तीव्रता के साथ प्रकाश-विद्युत धार...
Text Solution
|
- निम्न ग्राफ दो विभिन्न प्रकाश संवेदी पदार्थो एवं विभिन्न तीव्रताओं के ...
Text Solution
|
- Draw a graph showing variation of photoelectric current (I) with anode...
Text Solution
|