


Similar Questions
Explore conceptually related problems
Recommended Questions
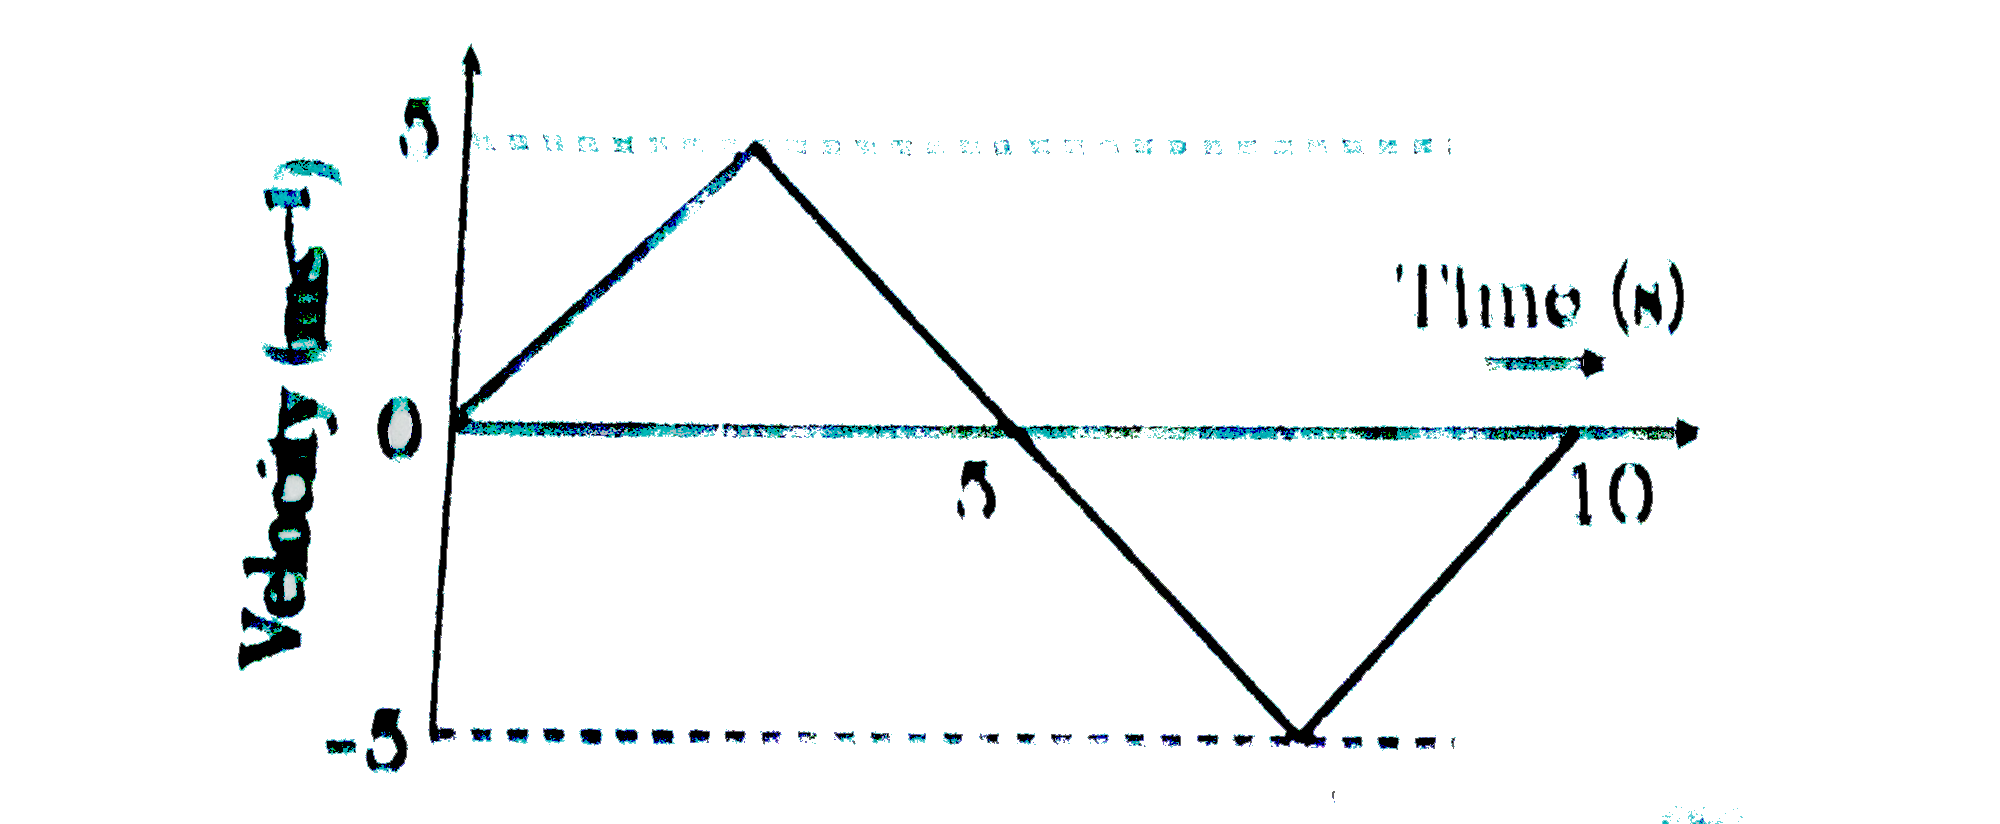
- The v-t plot of a moving object ios shown in the figure. The average v...
Text Solution
|
- The velocity-time plot is shown in figure. Find the average speed in t...
Text Solution
|
- An object and a plane mirror are shown in figure. Mirror is moved with...
Text Solution
|
- The v-t plot of a moving object ios shown in the figure. The average v...
Text Solution
|
- u वेग से गतिमान एक वस्तु पर बल लगाने पर वस्तु का वेग बढ़कर v हो जाता ...
Text Solution
|
- If the first half distance of an object is moving at a velocity v and ...
Text Solution
|
- The velocity of an object moving in a straight line path is given as a...
Text Solution
|
- m द्रव्यमान की एक वस्तु v वेग से गति करते हुए समान द्रव्यमान की स्थ...
Text Solution
|
- Velocity -time (v-t) graph for a moving object is shown in the figure....
Text Solution
|