


Similar Questions
Explore conceptually related problems
Recommended Questions
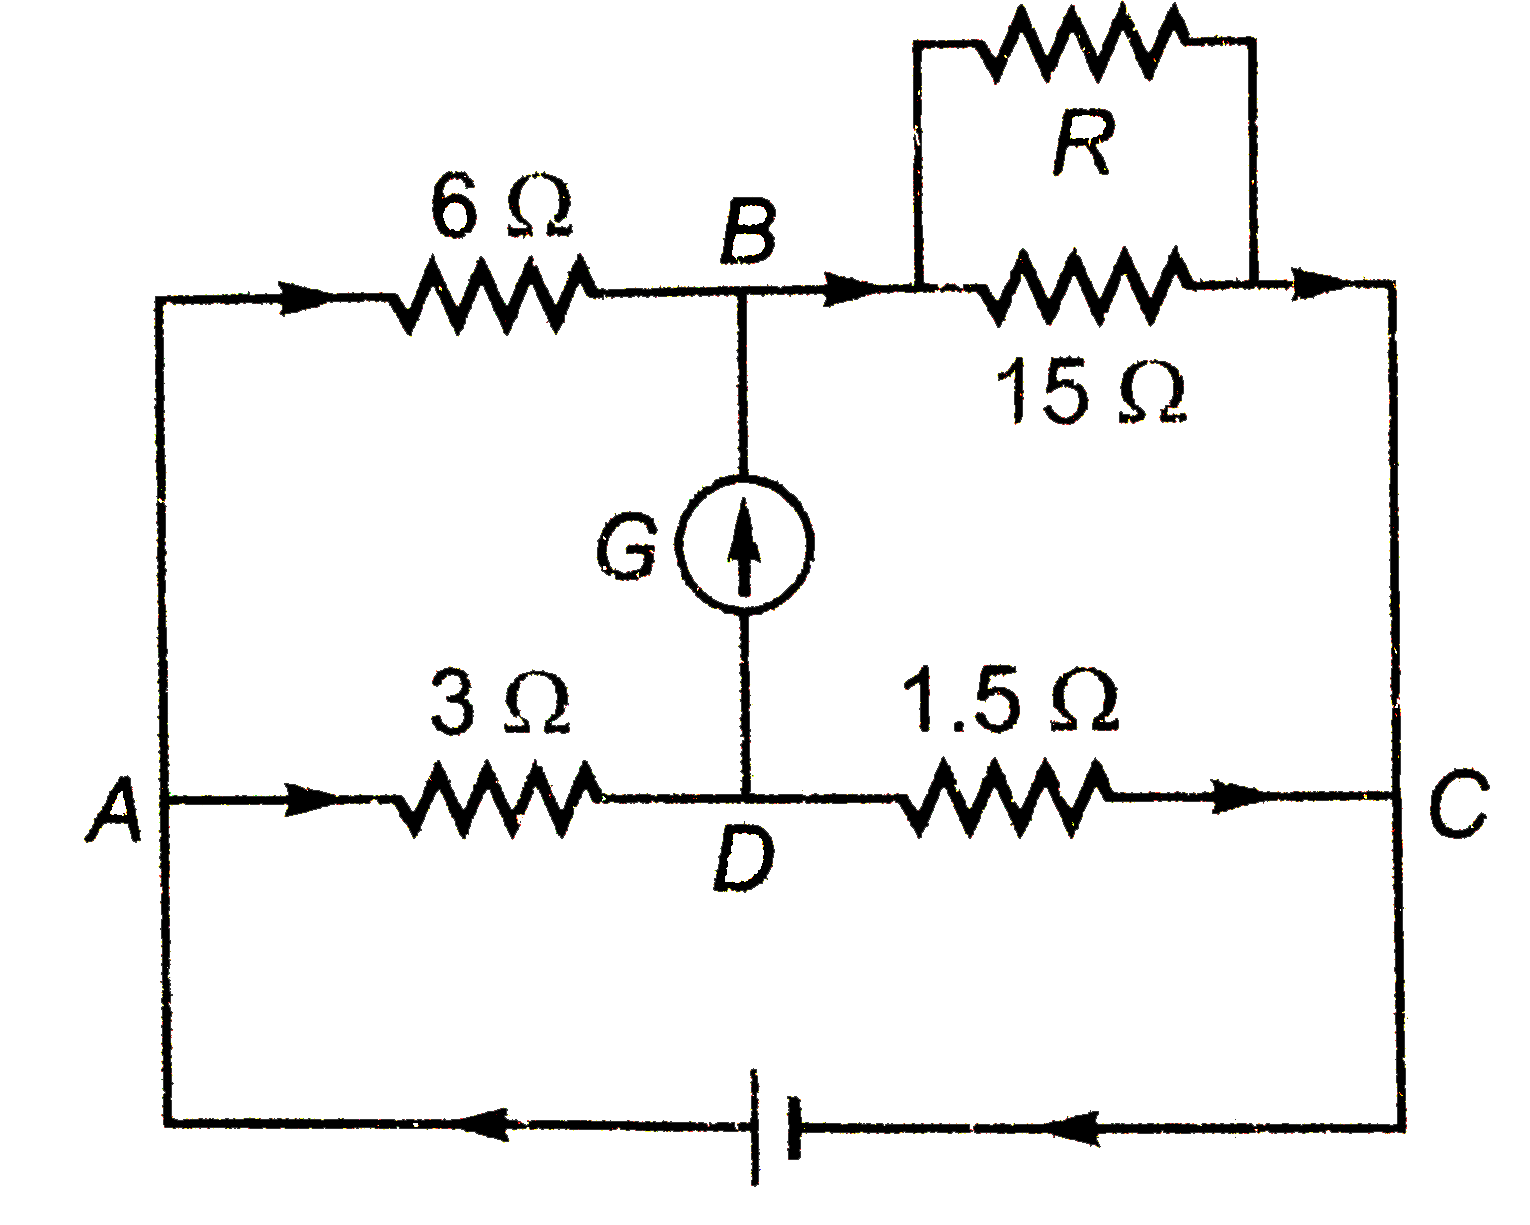
- चित्र में प्रदर्शित आरेख संतुलित व्हीटस्टोन सेतु प्रदर्शित करता है । R...
Text Solution
|
- त्रिविमीय निर्देशांक पद्धति में समीकरण 3y+4z=0 प्रदर्शित करता है -
Text Solution
|
- व्हीटस्टोन सेतु | | मीटर सेतु | | किरचाफ़ तथा व्हीटस्टोन सेतु पर...
Text Solution
|
- व्हीटस्टोन सेतु |मीटर सेतु
Text Solution
|
- The demand curve shows that price and quantity demanded are- मांग क्...
Text Solution
|
- If A denotes - C denotes xx D denotes :- E denotes + then 14C3A12E4D2...
Text Solution
|
- निम्नलिखित में से कौनसा सूत्र केंद्रीय परमाणु की बंधन क्षमता को सही रू...
Text Solution
|
- निम्नलिखित में से कौन सा द्रव युग्म राउल्ट के नियम से धनात्मक विचलन प्...
Text Solution
|
- निम्नलिखित में से कौन सा युग्म बंधन समावयवियों को प्रदर्शित करता है?
Text Solution
|