


Similar Questions
Explore conceptually related problems
Recommended Questions
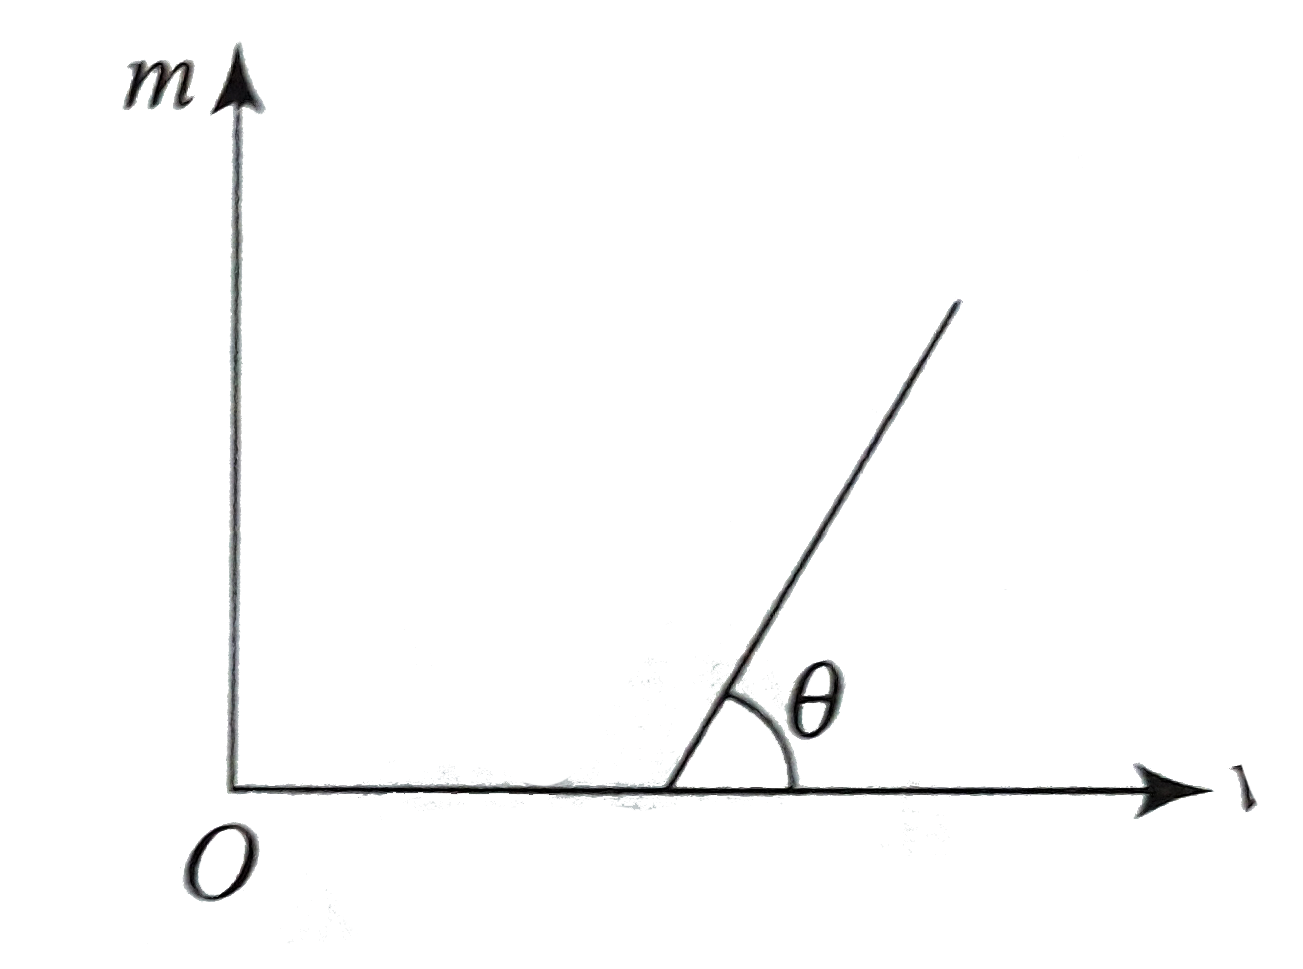
- Figure, shows variation of magnification m (produced by a thin convex ...
Text Solution
|
- Figure, shows variation of magnification m (produced by a thin convex ...
Text Solution
|
- The graph shows how the magnification m produced by a convex thin len...
Text Solution
|
- The graps shows the variation of magnification m produced by as convex...
Text Solution
|
- If the image formed by a thin convex lens of power P has magnification...
Text Solution
|
- Variation of magnification "("m")" produced by a thin convex lens vers...
Text Solution
|
- What is the nature of the image formed by a convex lens if the magnifi...
Text Solution
|
- What is the nature of the image formed by a convex lens if the magnifi...
Text Solution
|
- लेन्स की वस्तु से दुरी (u), लेन्स की प्रतिबिम्ब से दुरी (v) तथा लेन्स ...
Text Solution
|