 .
.


Similar Questions
Explore conceptually related problems
Recommended Questions
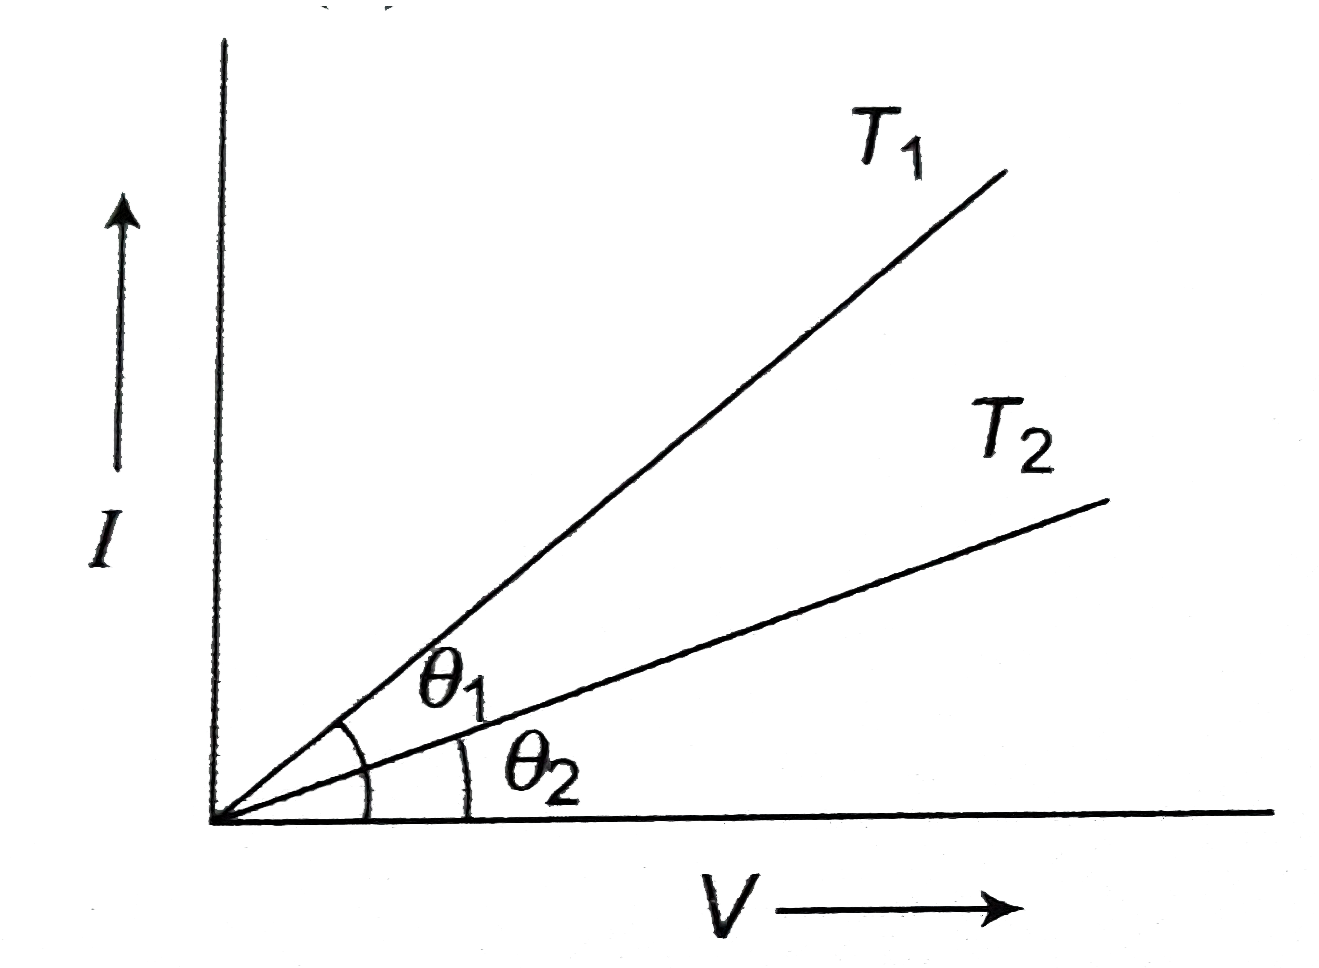
- The current-voltage graph for a given speciment at two different tempe...
Text Solution
|
- The current - voltage graphs for a given metallic wire at two differen...
Text Solution
|
- The current voltage graphs for a given metalic wire two different temp...
Text Solution
|
- The current in a metallic conductor is plotted against voltage at two ...
Text Solution
|
- The current-voltage graph for a given speciment at two different tempe...
Text Solution
|
- I-V graph for a given metallic wire at two temperatures T1 and T2 is a...
Text Solution
|
- The voltage-current (V-I) graph of a metallic conductor at two differe...
Text Solution
|
- V-I graph for a mettalic wire at two different temperatures T1 and T2 ...
Text Solution
|
- The voltage - current (V-1) graphs for a metallic conductor at two dif...
Text Solution
|