


Similar Questions
Explore conceptually related problems
Recommended Questions
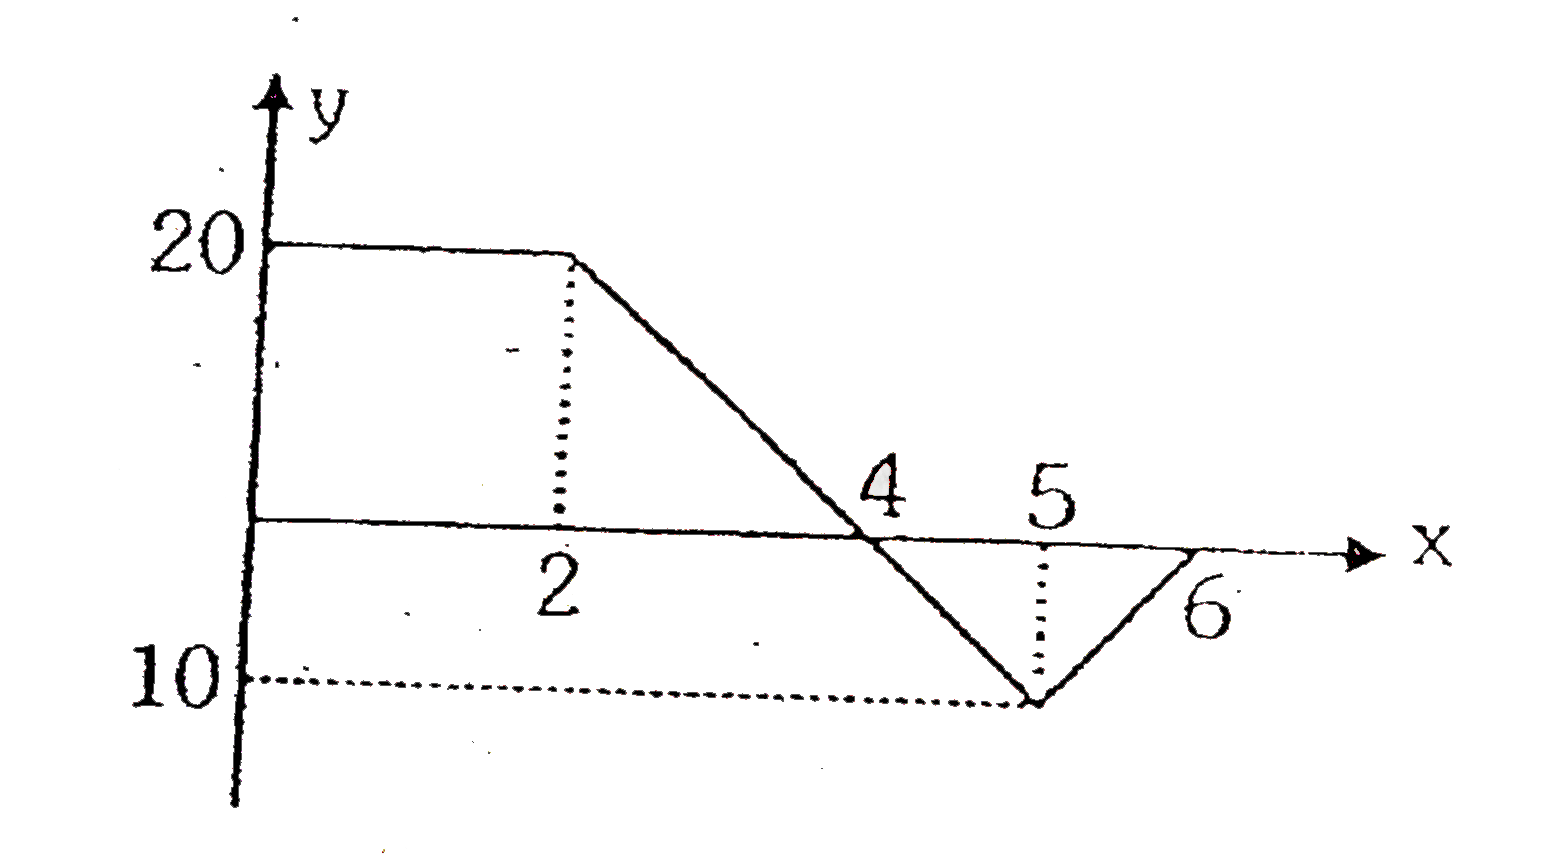
- The following curve represents a function y=f(x). Find average value o...
Text Solution
|
- The graph of the function y=f(x). Then which of the following could re...
Text Solution
|
- Suppose that fis differentiable function with the proporty f(x+y)=f(x)...
Text Solution
|
- Let (dy)/(dx)=(6)/(x+y) where y(0)=0 then the value of y when x+y=6 is
Text Solution
|
- The following curve represent rate of change of a variable y w.r.t. x....
Text Solution
|
- The following curve represents a function y=f(x). Find average value o...
Text Solution
|
- The following curve represent rate of change of a variable y w.r.t. x....
Text Solution
|
- Let f(x) be a function which satisfy the equation f(xy)=f(x)+f(y) for ...
Text Solution
|
- A function y =f(x) is defined as follow: " " y= f(x) ={ (x...
Text Solution
|