


Similar Questions
Explore conceptually related problems
Recommended Questions
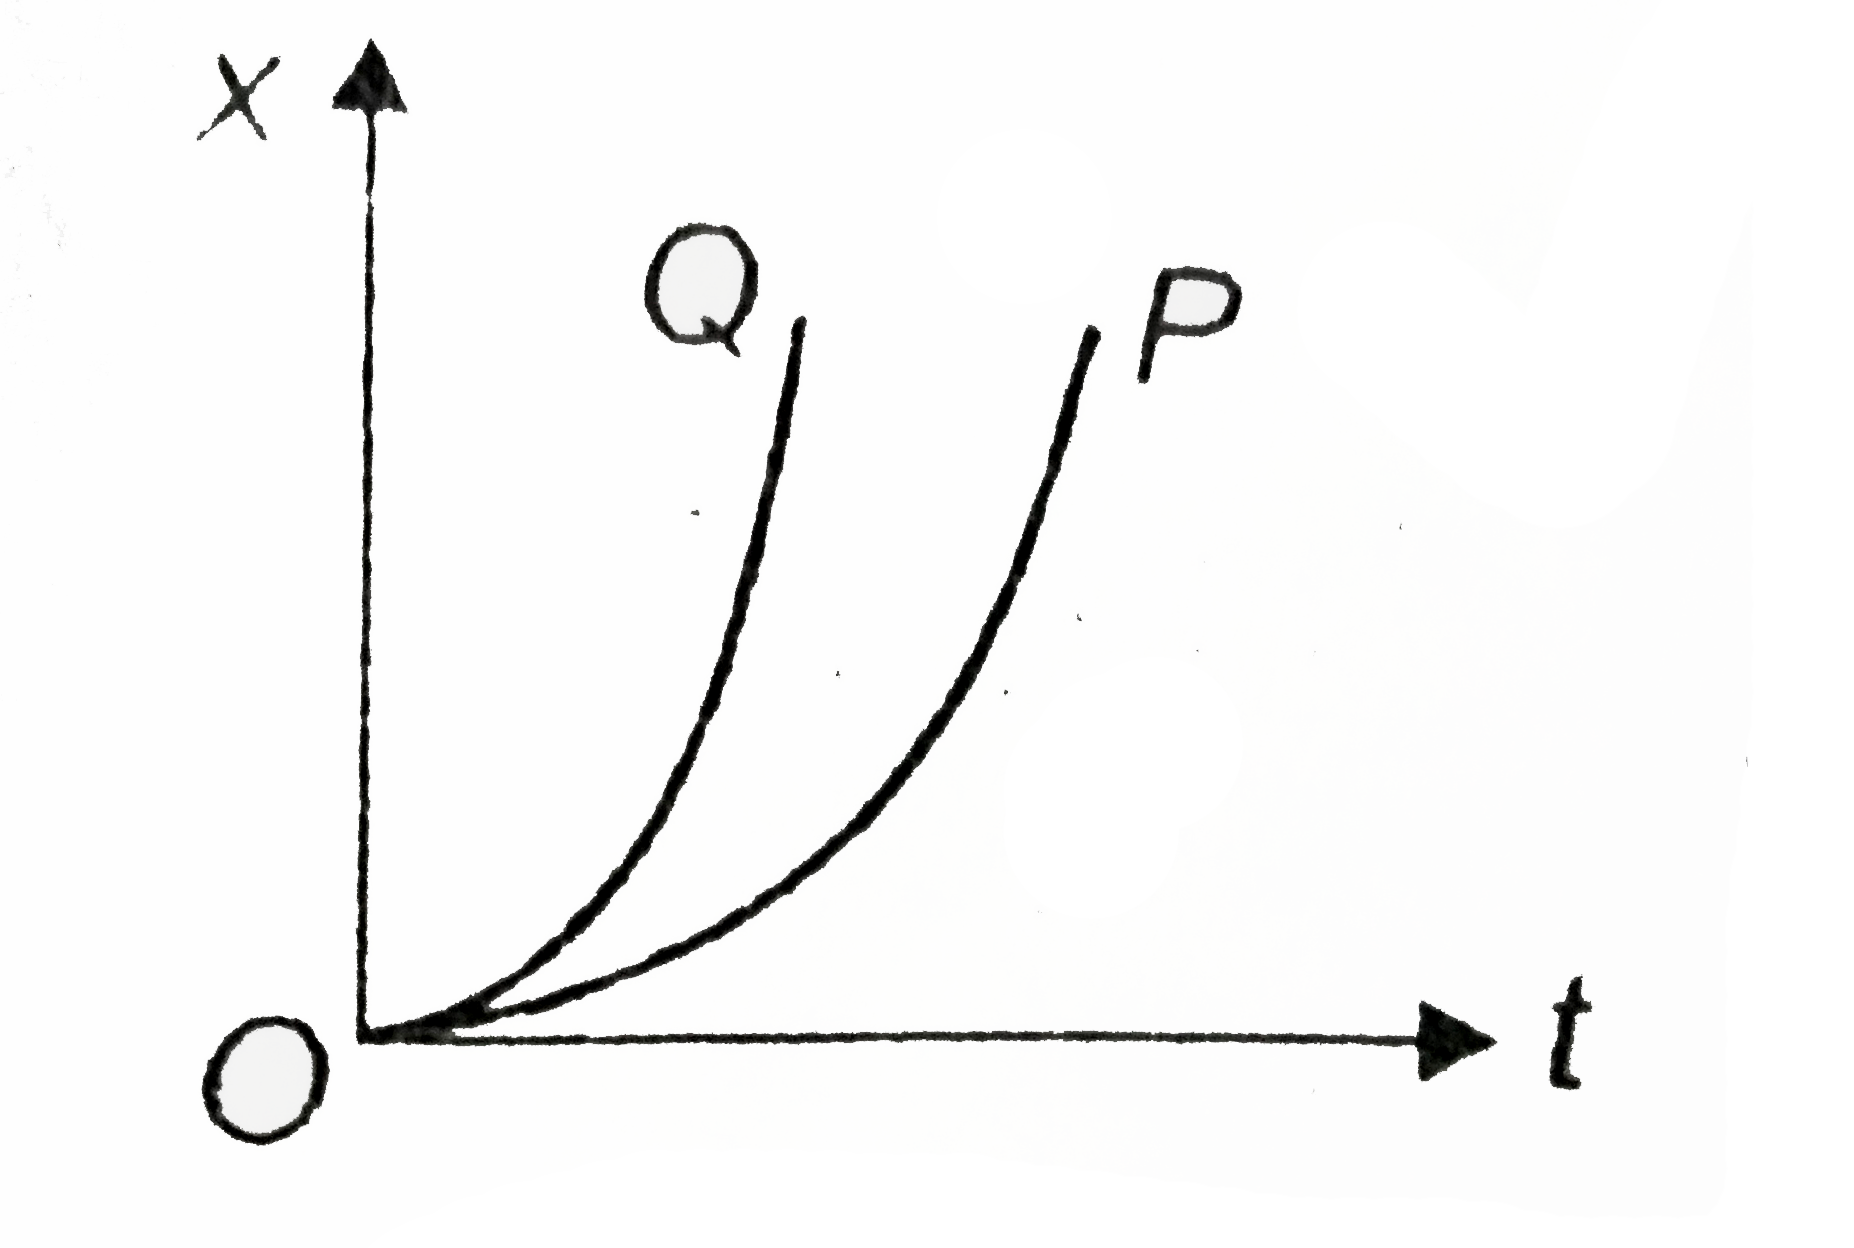
- The position-time graph for two particles P and Q moving on x-axis is ...
Text Solution
|
- Two bodies P and Q are moving along positive x-axis their position-tim...
Text Solution
|
- Two particles P and Q are moving as shown in the figure. At this momen...
Text Solution
|
- A particle is moving along X-axis under a force such that its position...
Text Solution
|
- A particle is moving along X-axis under a force such that its position...
Text Solution
|
- A particle is moving along X-axis under a force such that its position...
Text Solution
|
- A particle is moving along X-axis under a force such that its position...
Text Solution
|
- A particle is moving along X-axis under a force such that its position...
Text Solution
|
- The velocity-time graph for a particle moving along X-axis is shown in...
Text Solution
|