


Similar Questions
Explore conceptually related problems
Recommended Questions
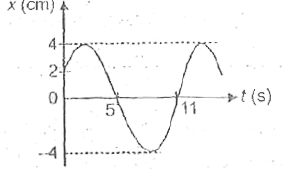
- Figure shows the position -time graph of an object in SHM. The correct...
Text Solution
|
- Part of SHM is graphed in the figure. Here, y is displacement from mea...
Text Solution
|
- Figure shows the position the graph for a particle in one dimensional ...
Text Solution
|
- The figure shows the displacement-time graph of a particle executing S...
Text Solution
|
- Figure shows the position-time graph of an abject in SHM. The correct ...
Text Solution
|
- निम्नांकित चित्र 3.64 में वस्तु की एकसमान गति प्रदर्शित करने वाला ग्रा...
Text Solution
|
- Figure shows the position -time graph of an object in SHM. The correct...
Text Solution
|
- Draw a distance-time graph showing the motion of an object as if the v...
Text Solution
|
- The displacement-time graph of a moving object is shown in figure. Whi...
Text Solution
|