


NCERT ENGLISH-PHOTOSYNTHESIS IN HIGHER PLANTS-EXERCISE
- By looking at a plant externally can you tell whether a plant is C(3) ...
Text Solution
|
- By looking at which internal structure of a plant can you tell whether...
Text Solution
|
- Even though a very few cells in a C(4) plant carry out the biosynthet...
Text Solution
|
- RuBisCo is an enzyme that acts both as a carboxylase and oxygenase. Wh...
Text Solution
|
- Suppose there were plants that had a high concentration of Chlorophyll...
Text Solution
|
- Why is the colour of a leaf kept in the dark frequently yellow, or pal...
Text Solution
|
- Look at leaves of the same plant on the shady side and compare it with...
Text Solution
|
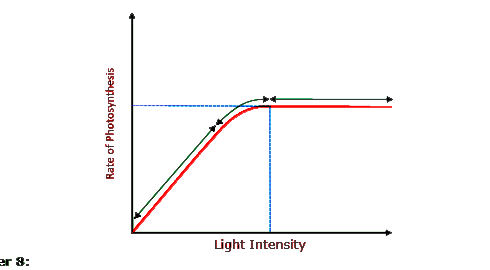
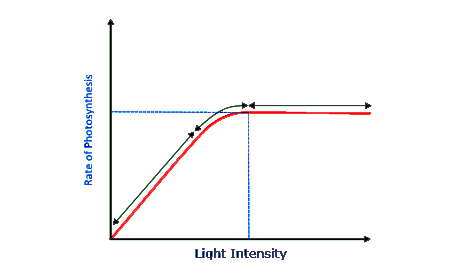
- Figure 13.10 shows the effect of light on the rate of photosynthesis. ...
Text Solution
|
- Give comparison between the following: (a) C(3) and C(4) pathway...
Text Solution
|