


Similar Questions
Explore conceptually related problems
Recommended Questions
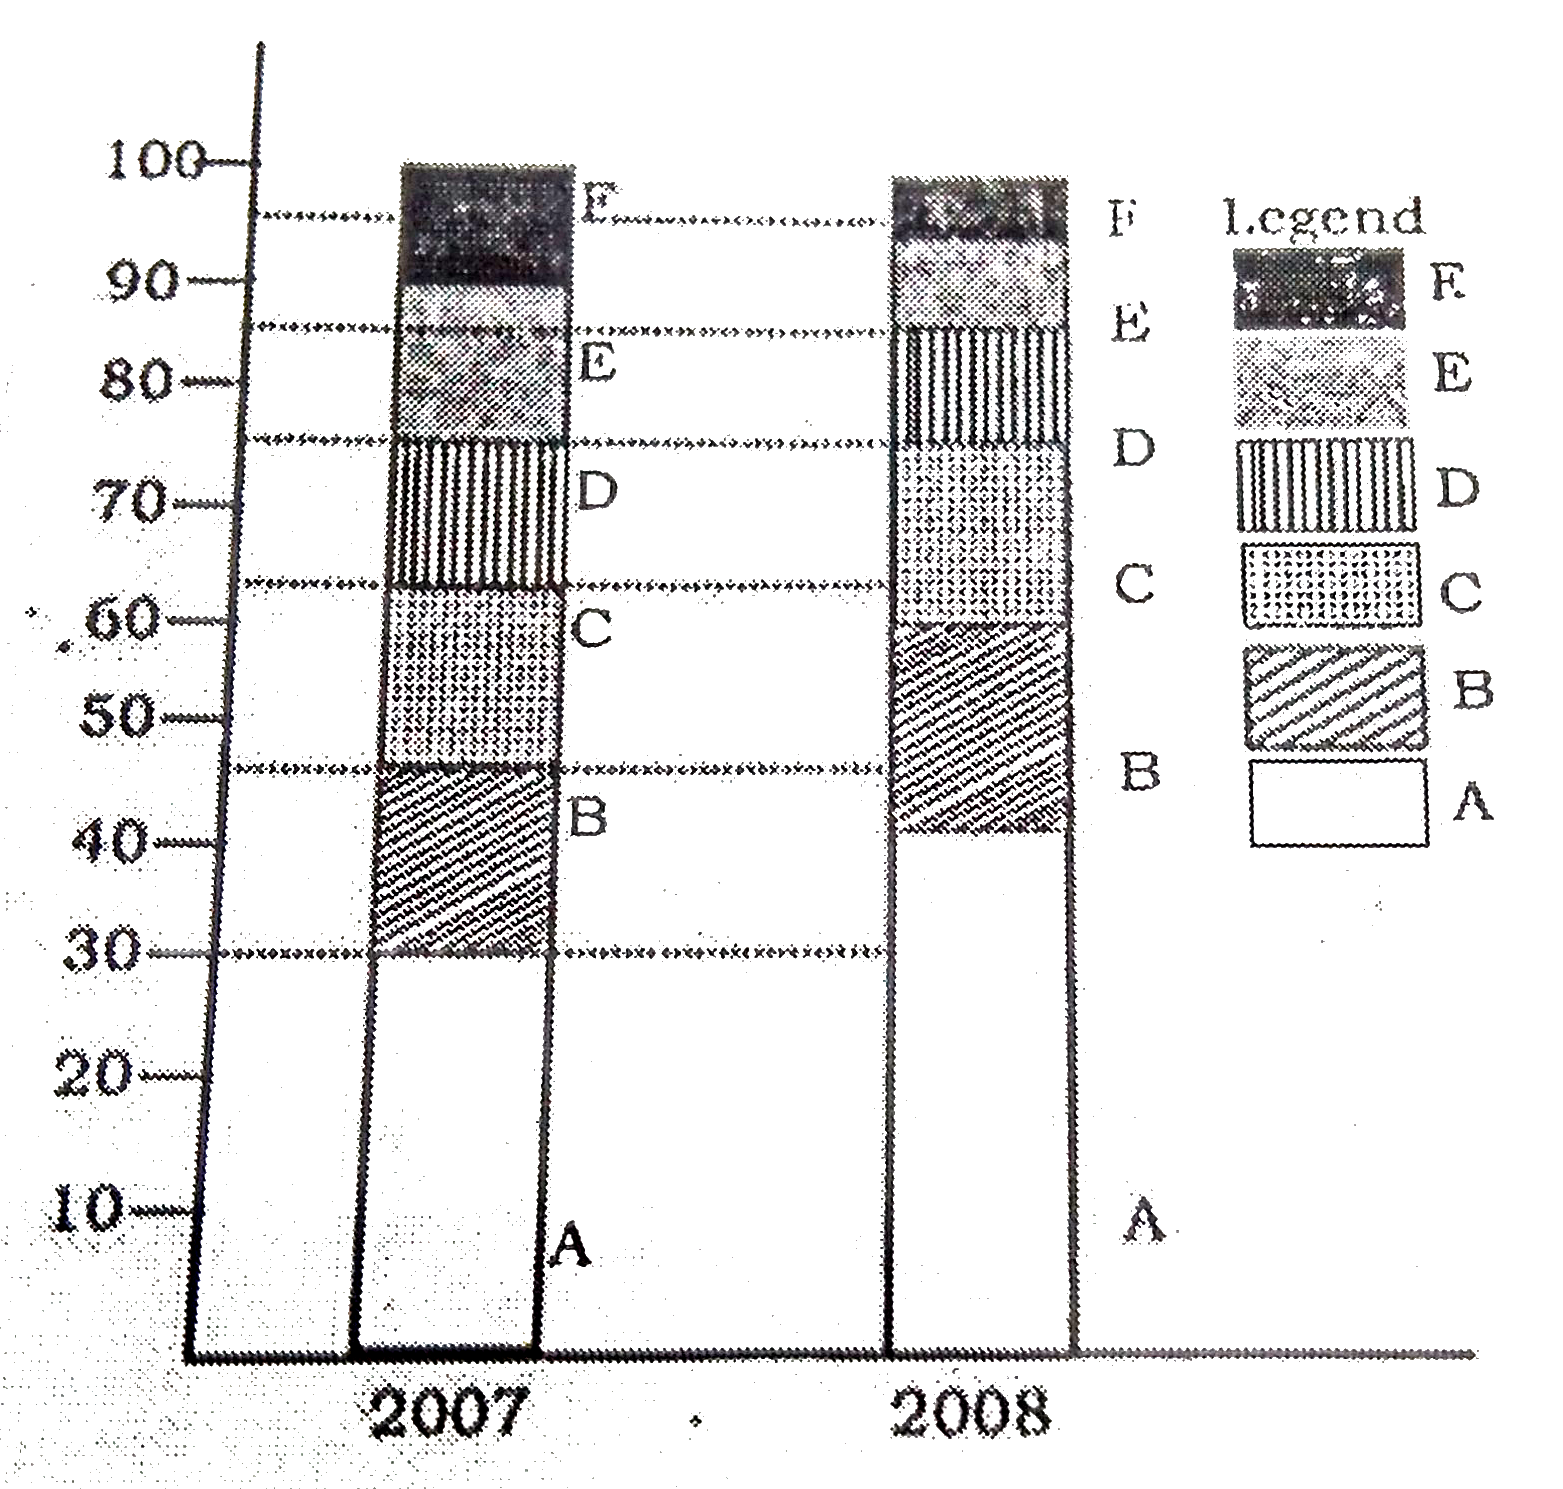
- The bar chart given below shows the percentage distribution of the pro...
Text Solution
|
- The bar chart given below shows the percentage distribution of the pro...
Text Solution
|
- The bar chart given below shows the percentage distribution of the pro...
Text Solution
|
- The bar chart given below shows the percentage distribution of the pro...
Text Solution
|
- The bar chart given below shows the percentage distribution of the pro...
Text Solution
|
- The bar chart given below shows the percentage distribution of the pro...
Text Solution
|
- The cost of the living index for 2008, taking 2007 as the base year, i...
Text Solution
|
- The bar chart given below shows the percentage distribution of the pro...
Text Solution
|
- The bar chart given below shows the percentage distribution of the pro...
Text Solution
|