निम्नलिखित सारणी एक वर्ग की जांच परीक्षा में ५० छात्रों के प्राप्तांको को दर्शाता है
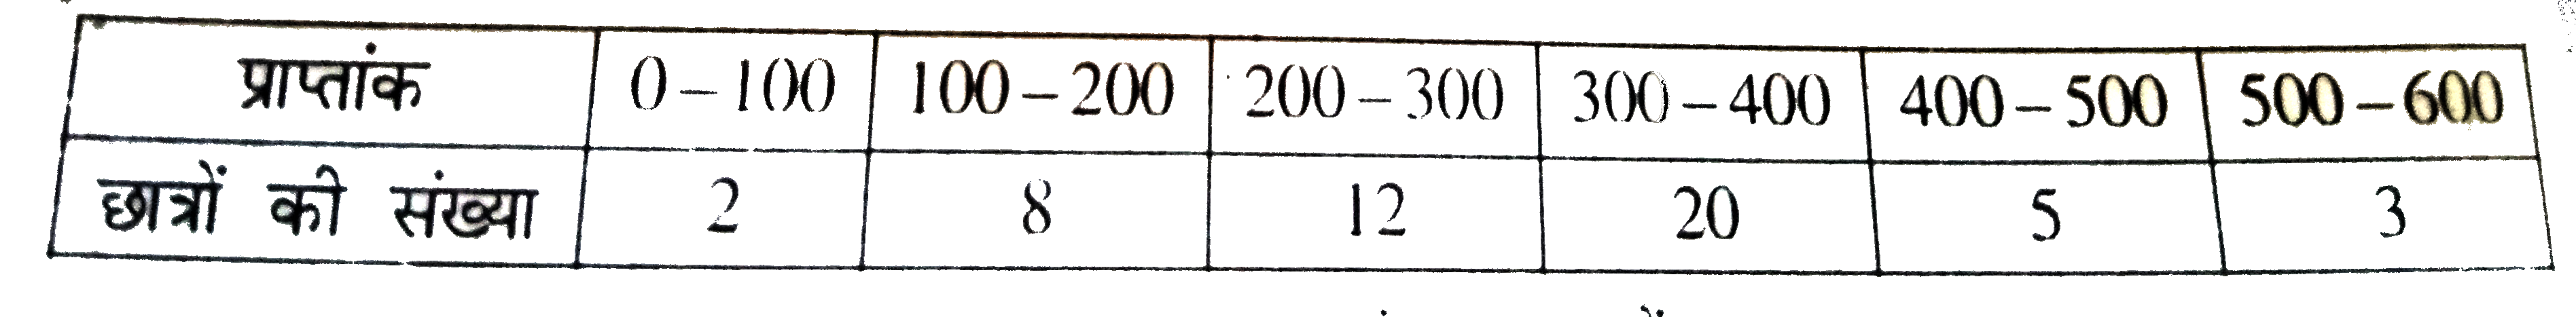
वर्ग जांच - परीक्षा में एक छात्र द्वारा प्राप्त माध्य अंक ज्ञात करे ।
निम्नलिखित सारणी एक वर्ग की जांच परीक्षा में ५० छात्रों के प्राप्तांको को दर्शाता है
वर्ग जांच - परीक्षा में एक छात्र द्वारा प्राप्त माध्य अंक ज्ञात करे ।
वर्ग जांच - परीक्षा में एक छात्र द्वारा प्राप्त माध्य अंक ज्ञात करे ।


Similar Questions
Explore conceptually related problems
The following chart shows the marks (in degrees) scored by a student in different subjects -- English, Hindi, History, Economics and Political Science -- in an examination. Total marks obtained in the examination are 600. Observe the chart and answer the questions. निम्नलिखित चार्ट एक परीक्षा में विभिन्न विषयों -अंग्रेजी, हिंदी, इतिहास, अर्थशास्त्र और राजनीति विज्ञान- में एक छात्र द्वारा प्राप्त अंकों (डिग्री में) को दर्शाता है। परीक्षा में प्राप्त कुल अंक 600 हैं। आरेख का अवलोकन कीजिए तथा प्रश्नों के उत्तर दीजिए। What is the difference between marks scored in History and marks scored in Hindi? इतिहास में प्राप्त अंकों और हिंदी में प्राप्त अंकों के बीच अंतर क्या है?
The following chart shows the marks (in degrees) scored by a student in different subjects -- English, Hindi, History, Economics and Political Science -- in an examination. Total marks obtained in the examination are 600. Observe the chart and answer the questions. निम्नलिखित चार्ट एक परीक्षा में विभिन्न विषयों -अंग्रेजी, हिंदी, इतिहास, अर्थशास्त्र और राजनीति विज्ञान- में एक छात्र द्वारा प्राप्त अंकों (डिग्री में) को दर्शाता है। परीक्षा में प्राप्त कुल अंक 600 हैं। आरेख का अवलोकन कीजिए तथा प्रश्नों के उत्तर दीजिए। What is the difference between marks scored in History and marks scored in Hindi? इतिहास में प्राप्त अंकों और हिंदी में प्राप्त अंकों के बीच अंतर क्या है?
The following pie-chart shows the marks scored by a students in different subjects - viz. Physics (ph), Chemistry (Ch), Mathematics (M), Social Science (SS) and English (E) in an examination. Assuming that total marks obtained for the examination is 810, answer the questions given below. The marks obtained in English, Physics and Social Science exceed the marks obtained in Mathematics and Chemistry by. निम्नलिखित वृत्तारेख, एक छात्र द्वारा एक परीक्षा में विभिन्न विषयो में प्राप्त अंक दर्शाता है, यथा भौतिकी (Ph), रसायन (Ch), गणित (M), सामाजिक विज्ञान (SS) और अग्रेंजी (E)। मान ले कि परीक्षा के लिए प्राप्त कुल अंक 810 है : अंग्रेजी, भौतिकी और सामाजिक विज्ञान में प्राप्त अंक गणित तथा रसायन में प्राप्त अंको से कितने अधिक है?
Study the given histogram that shows the marks obtained by students in an examination and answer the questions that follow दिए गए हिस्टोग्राम का अध्ययन करें जो एक परीक्षा में छात्रों द्वारा प्राप्त किए गए अंकों को दिखाता है और आने वाले प्रश्नों का उत्तर ज्ञात करे| The number of students who obtained less than 350 marks is what percent more than the number of students who obtained 400 or more marks?(correct to one decimal place ) 350 से कम अंक प्राप्त करने वाले छात्रों की संख्या 400 या अधिक अंक प्राप्त करने वाले छात्रों की संख्या की तुलना में प्रतिशत अधिक है| (एक दशमलव स्थान तक )
The given pie chart shows the marks obtained in an examination by a student (in degrees). Observe the pie chart and answer the question that follows: दिया गया पाई चार्ट एक छात्र द्वारा परीक्षा में प्राप्त अंकों (डिग्री में) को दर्शाता है। पाई चार्ट का निरीक्षण करें और निम्न प्रश्न का उत्तर दें: If the total marks are 720, then the marks obtained in English is what percentage of the marks obtained in Maths? यदि कुल अंक 720 हैं, तो अंग्रेजी में प्राप्त अंक गणित में प्राप्त अंकों का कितना प्रतिशत है?
The given pie chart shows the marks obtained in an examination by a student (in degrees). Observe the pie chart and answer the question that follows: दिया गया पाई चार्ट एक छात्र द्वारा परीक्षा में प्राप्त अंकों (डिग्री में) को दर्शाता है। पाई चार्ट का निरीक्षण करें और निम्न प्रश्न का उत्तर दें: If total marks are 720, then the marks obtained in Chemistry, Biology and Maths together is what percentage of the total marks? यदि कुल अंक 720 हैं, तो रसायन विज्ञान, जीव विज्ञान और गणित में प्राप्त अंक कुल अंकों का कितना प्रतिशत है?
The graph shows the result of 10th class students of a school for 4 years. Study the graph and answer the questions: The number of students appeared for the 10th class exam in the year 2002 is. निम्नलिखित दण्ड आरेख 10 वीं कक्षा के छात्रों का 4 वर्ष का परीक्षा परिणाम दर्शाता है। आरेख का अध्ययन कीजिए और निम्नलिखित प्रश्नों का उत्तर दीजिए : छात्रों की संख्या वर्ष 2002 में 10 वीं कक्षा की परीक्षा में शामिल छात्रों की संख्या बताइए:
The following pie chart shows the percentage-wise distribution of the number of students in five different schools P, Q, R, S and T. The total number of students in all five schools together is 8400. निम्नलिखित पाई चार्ट पांच अलग-अलग स्कूलों P, Q, R, S और T में छात्रों की संख्या के प्रतिशत को दर्शाता है। सभी पाँच स्कूलों में कुल छात्रों की संख्या 8400 है Find the average number of students in schools R and S together. स्कूलों R और S में एक साथ छात्रों की औसत संख्या ज्ञात कीजिए।
Recommended Questions
- निम्नलिखित सारणी एक वर्ग की जांच परीक्षा में ५० छात्रों के प्राप्तांको...
Text Solution
|
- How many lines of symmetry does the above figure have ? <img src="http...
Text Solution
|
- Which of the following are correct chain isomers of butane ? (i) <img ...
Text Solution
|
- Determine the point of symmetry of a regular hexagon. <img src="htt...
Text Solution
|
- Dtermine the images of the following figure about the given line : ...
Text Solution
|
- Match the following Column A to Column B
Text Solution
|
- Match the following Column A to Column B
Text Solution
|
- Match the following Column A to Column B
Text Solution
|
- Find the area of the figure given below.
Text Solution
|