


Similar Questions
Explore conceptually related problems
Recommended Questions
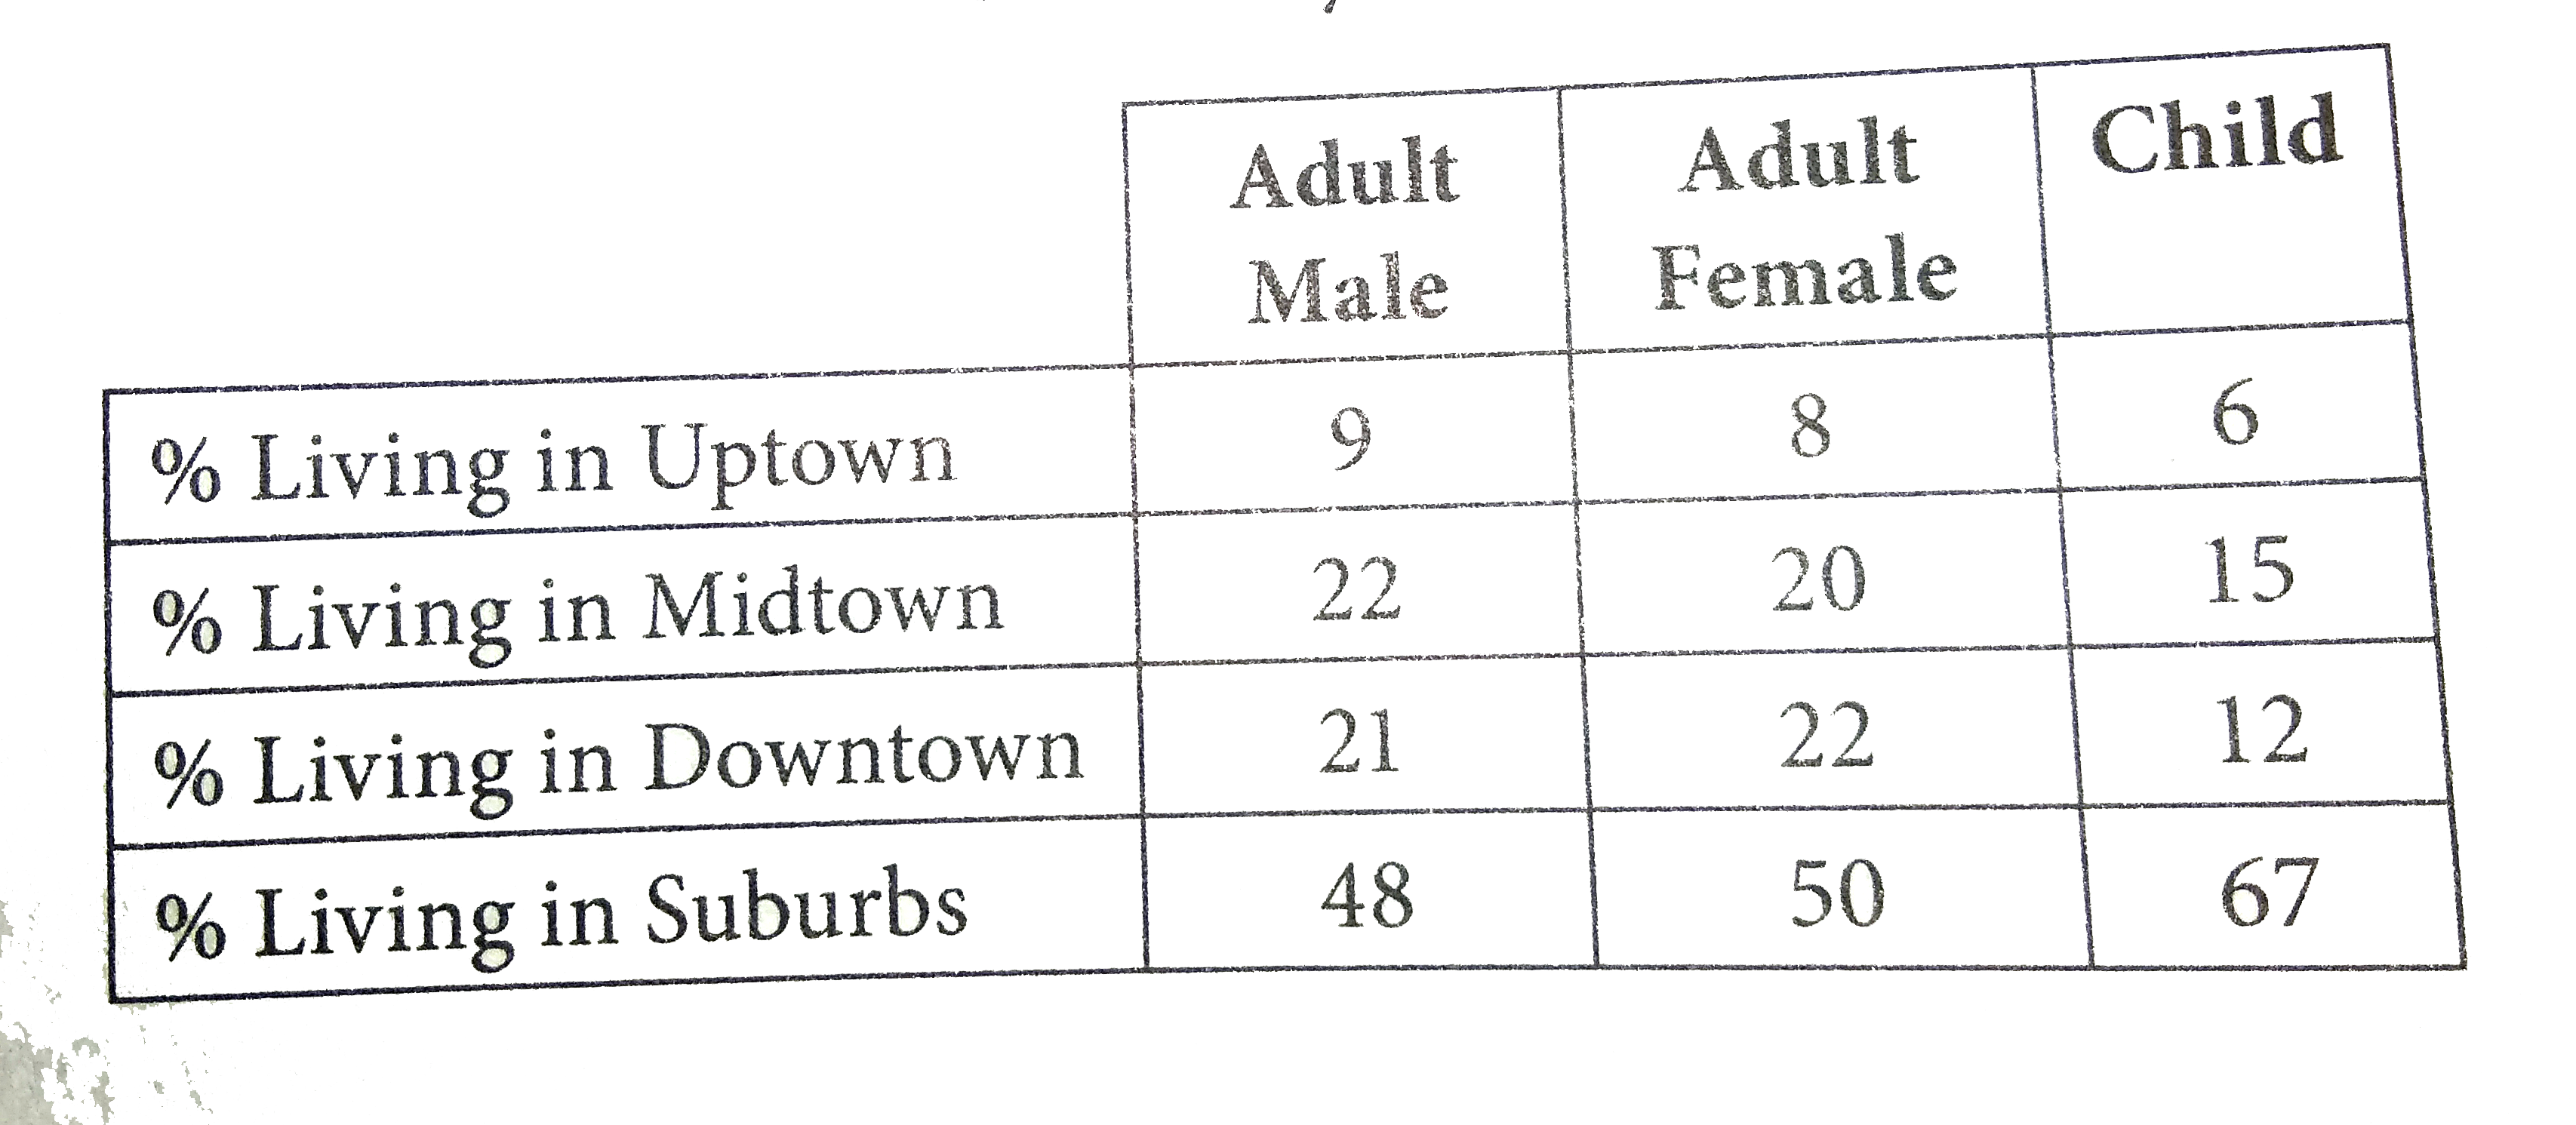
- The chart below shows the population distribution for the 2,400 occupa...
Text Solution
|
- The population of a city is 6,63,432. If (1)/(2) of the population are...
Text Solution
|
- Which of the following are correct chain isomers of butane ? (i) <img ...
Text Solution
|
- Determine the point of symmetry of a regular hexagon. <img src="htt...
Text Solution
|
- Dtermine the images of the following figure about the given line : ...
Text Solution
|
- Match the following Column A to Column B
Text Solution
|
- Match the following Column A to Column B
Text Solution
|
- Match the following Column A to Column B
Text Solution
|
- Find the area of figure given below.
Text Solution
|