A
B
C
D
Text Solution
Verified by Experts
The correct Answer is:


Similar Questions
Explore conceptually related problems
Recommended Questions
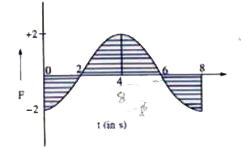
- A force-time graph for the motion of a body is shown in figure. Change...
Text Solution
|
- A body of 2kg has an initial speed 5ms^(-1) . A force acts on it for s...
Text Solution
|
- A force-time graph for the motion of a body is shown in the figure. Th...
Text Solution
|
- Assertion : Torque is time rate of change of a parameter, called angua...
Text Solution
|
- A force time graph for the motion of a body is as shown in Change in l...
Text Solution
|
- A force - time graph for a linear motion is shown in the figure where ...
Text Solution
|
- The force-time( F – t ) curve of a particle executing linear motion is...
Text Solution
|
- A force time graph for the motion of a body is as shown in figure. Cha...
Text Solution
|
- A force lime graph for the motion of a body is as shown in figure. Cha...
Text Solution
|