


Similar Questions
Explore conceptually related problems
Recommended Questions
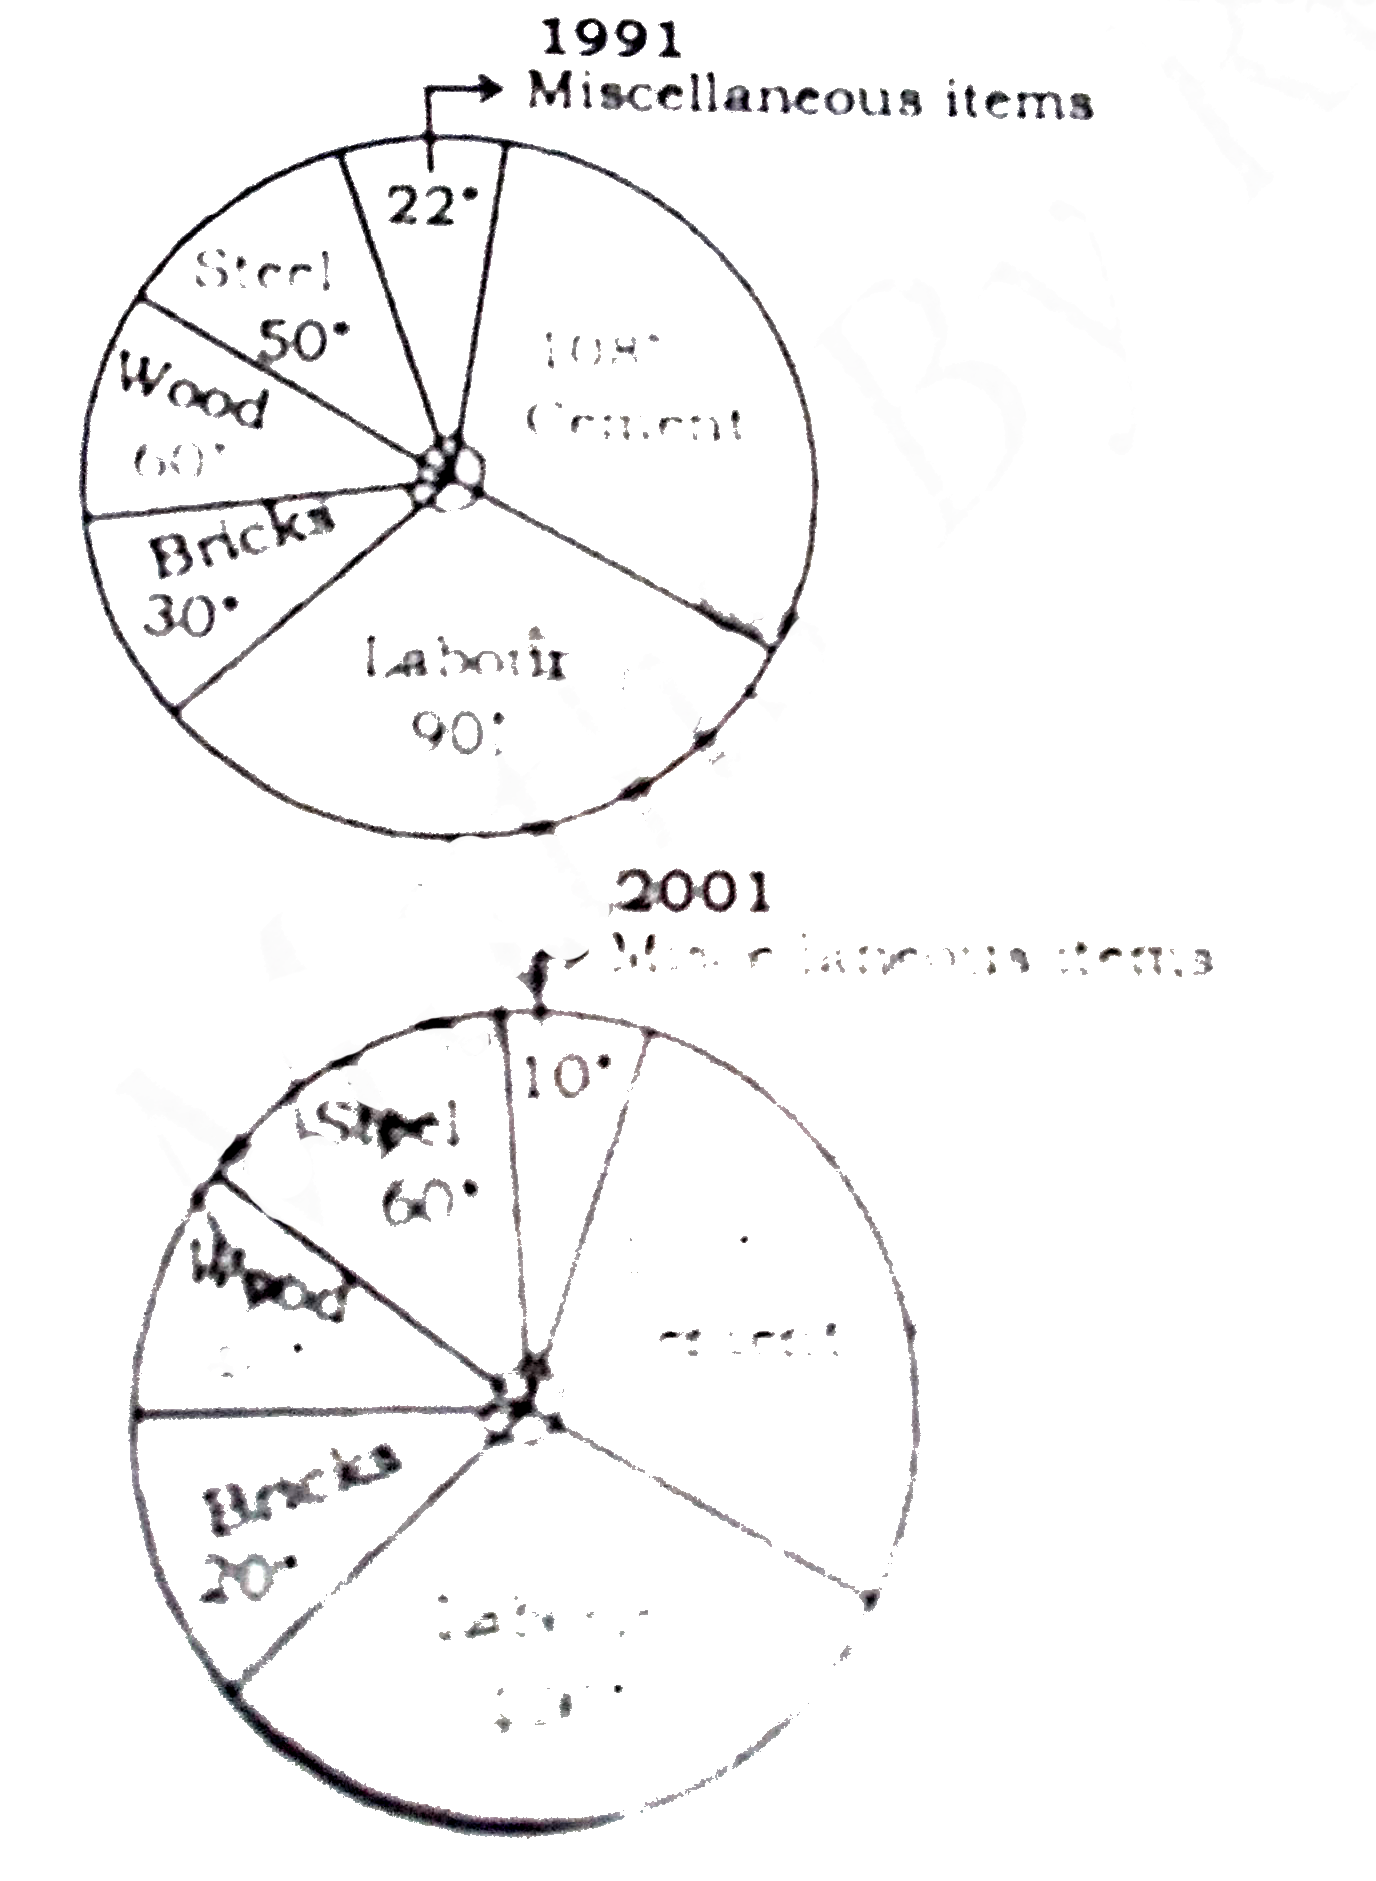
- Pie charts show the expenses on various heads show the expenses on var...
Text Solution
|
- Pie charts show the expenses on various heads show the expenses on var...
Text Solution
|
- Pie charts show the expenses on various heads show the expenses on var...
Text Solution
|
- Pie charts show the expenses on various heads show the expenses on var...
Text Solution
|
- यह ज्ञात है की महाविद्यालय के छात्रों में से 60 % छात्रावास में रहते ...
Text Solution
|
- The population of a town has increased by 5% at the end of the first y...
Text Solution
|
- The given bar graph shows the number of marks scored by a student in e...
Text Solution
|
- The given Bar Graph presents the sales of the number of books (in thou...
Text Solution
|
- The Pie-chart given below shows the figures of various heads of expend...
Text Solution
|