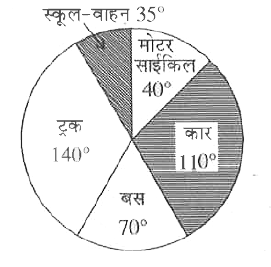
निम्न वृत्त -चित्र एक अभ्यर्थी द्वारा प्रदूषण जांच अभियान के द्वारा विभिन्न वाहनों के विभाजन को दर्शाता है -इस चित्र को पढ़कर निचे दिये गये प्रशनो का उत्तर दीजिए -
यदि कुल प्रदूषण `720^(@)` इकाई है तो
कारो द्वारा किये गये प्रदूषण की मात्रा बताओ।
निम्न वृत्त -चित्र एक अभ्यर्थी द्वारा प्रदूषण जांच अभियान के द्वारा विभिन्न वाहनों के विभाजन को दर्शाता है -इस चित्र को पढ़कर निचे दिये गये प्रशनो का उत्तर दीजिए -
यदि कुल प्रदूषण `720^(@)` इकाई है तो
कारो द्वारा किये गये प्रदूषण की मात्रा बताओ।
यदि कुल प्रदूषण `720^(@)` इकाई है तो
कारो द्वारा किये गये प्रदूषण की मात्रा बताओ।


Similar Questions
Explore conceptually related problems
The given table represents the number of engineers recruited by four companies A,B,C and D over the years. Study the table carefully and answer the questions that follows:The total number of engineers recruited by company A in 2014 to 2017 is what percentage more than the total number of engineers recruited by all the four companies in 2019? दी गयी तालिका चार कंपनियों A, B, C और D के द्वारा इन वर्षों के दौरान भर्ती किये गए इंजीनियरों की संख्या दर्शाती है | इस तालिका का ध्यानपूर्वक अध्ययन करें तथा इसके बाद पूछे गए प्रश्न का उत्तर दें | कंपनी A के द्वारा 2014 से 2017 की अवधि में भर्ती किये गए इंजीनियरों की कुल संख्या सभी चार कंपनियों के द्वारा 2019 में भर्ती किये गए इंजीनियरों की कुल संख्या से कितना प्रतिशत अधिक है ?
The given table represents the number of engineers recruited by four companies A,B,C and D over the years. Study the table carefully and answer the questions that follows: The ratio of the total number of engineers recruited by companies A and B in 2015 and 2018 to the total number of engineers recruited by C and D in 2014 and 2018 is: दी गयी तालिका चार कंपनियों A, B, C और D के द्वारा इन वर्षों के दौरान भर्ती किये गए इंजीनियरों की संख्या दर्शाती है | इस तालिका का ध्यानपूर्वक अध्ययन करें तथा इसके बाद पूछे गए प्रश्न का उत्तर दें | कंपनी A और B के द्वारा 2015 और 2018 में भर्ती किये गए इंजीनियरों की कुल संख्या एवं C तथा D के द्वारा 2014 और 2018 में भर्ती किये गए इंजीनियरों की कुल संख्या के बीच अनुपात ज्ञात करें |
The given table represents the number of engineers recruited by four companies A,B,C and D over the years. Study the table carefully and answer the questions that follows: The total number of engineers recruited by the company B in 2014 and 2017 is what percentage of the total number of engineers recruited by C during 2015 to 2019? दी गयी तालिका चार कंपनियों A, B, C और D के द्वारा इन वर्षों के दौरान भर्ती किये गए इंजीनियरों की संख्या दर्शाती है | इस तालिका का ध्यानपूर्वक अध्ययन करें तथा इसके बाद पूछे गए प्रश्न का उत्तर दें | कंपनी B के द्वारा 2014 और 2017 में भर्ती किये गए इंजीनियरों की कुल संख्या C के द्वारा 2015 से 2019 के दौरान भर्ती किये गए इंजीनियरों की कुल संख्या का कितना प्रतिशत है ?
The given Bar Graph presents the number of different types of vehicles exported by a company in 2017 and 2018.What is the ratio of the total number of vehicles exported in 2017 of types B, C and D to that of vehicles exported in 2018 of the types A, D and E? दिया गया दंड आरेख एक कंपनी के द्वारा 2017 और 2018 में निर्यात किये गए अलग-अलग प्रकार के वाहनों की संख्या को दर्शाता है | 2017 में निर्यात किये गए B, C और D प्रकार के वाहनों की कुल संख्या का 2018 में निर्यात किये गए A, D और E प्रकार के वाहनों की संख्या के साथ अनुपात ज्ञात करें |
The following pie-chart shows the market share of exporting countries. If the share of a country X is equal to 40% of the share of .other countries. and the volume of exports of the country B is Rs 15 million, then the quantity exported by the country X is: निम्नलिखित वृत्त आरेख निर्यातक देशों की बाजार हिस्सेदारी को दर्शाता है | यदि देश X की हिस्सेदारी .दूसरे देशों. की हिस्सेदारी के 40% के बराबर है और देश B के निर्यात की मात्रा रु 15 मिलियन है, तो देश द्वारा निर्यात की गई मात्रा है :
The bar graph provided below represents the production of rice and wheat in different states of a country in the certain year. Answer the questions based on the bar graph. नीचे दिये गया बार-ग्राफ एक निश्चित वर्ष में विभिन्न प्रदेशों में चावल और गेहूँ की उपज को दर्शाता है। इस ग्राफ पर आधारित प्रश्नों के उत्तर दें। The average of production of rice in the mentioned states (in lakh tonnes) is दिये गये प्रदेशों में चावल की उपज का औसत (लाख टनों में) है-
The bar graph provided below represents the production of rice and wheat in different states of a country in the certain year. Answer the questions based on the bar graph. नीचे दिये गया बार-ग्राफ एक निश्चित वर्ष में विभिन्न प्रदेशों में चावल और गेहूँ की उपज को दर्शाता है। इस ग्राफ पर आधारित प्रश्नों के उत्तर दें। The ratio of total production of rice in the mentioned states to that of wheat in those states, is दिये गये प्रदेशों में चावल की कुल उपज का गेहूँ की कुल उपज से अनुपात है-
The bar graph provided below represents the production of rice and wheat in different states of a country in the certain year. Answer the questions based on the bar graph. नीचे दिये गया बार-ग्राफ एक निश्चित वर्ष में विभिन्न प्रदेशों में चावल और गेहूँ की उपज को दर्शाता है। इस ग्राफ पर आधारित प्रश्नों के उत्तर दें। The total production of rice and wheat in all the mentioned states in minimum in the state. दिये गये सभी प्रदेशों में से किस प्रदेश में चावल व गेहूँ को कुल उपज सबसे कम है?
The pie-chart given below shows the expenses incurred by various departments of a company. Each expense is shown as a percentage of the company.s total expenditure. The central angles shown in the pie-chart are not according to any selected scale. नीचे दिया गया वृत्त आरेख किसी कंपनी के विभिन्न विभागों द्वारा किए खर्चों को दर्शाता है | प्रत्येक खर्च को कंपनी के कुल व्यय के प्रतिशत के रूप में दर्शाया गया है | वृत्त आरेख में दर्शाए गए केंद्रीय कोण किसी चयनित पैमाने के अनुसार नहीं हैं | If the total expenses of the company is 20 lacs, then find the total expenses incurred on the departments D2, D4 and D5. यदि कंपनी के कुल खर्चे रु 20 लाख हैं, तो D2, D4 तथा D5 विभागों पर किया गया कुल खर्चा कितना है ?
Recommended Questions
- निम्न वृत्त -चित्र एक अभ्यर्थी द्वारा प्रदूषण जांच अभियान के द्वारा वि...
Text Solution
|
- निचे दिये गये ग्राफ में दो प्रकार के वाहनों A व B के छ वर्षो के प्रद...
Text Solution
|
- निचे दिये गये ग्राफ में दो प्रकार के वाहनों A व B के छ वर्षो के प्रद...
Text Solution
|
- निचे दिये गये ग्राफ में दो प्रकार के वाहनों A व B के छ वर्षो के प्रद...
Text Solution
|
- निचे दिये गये ग्राफ में दो प्रकार के वाहनों A व B के छ वर्षो के प्रद...
Text Solution
|
- चित्र में दिया गया वृत्त चार्ट मई -जून 2013 के दौरान वाहनों का केन्...
Text Solution
|
- चित्र में दिया गया वृत्त चार्ट मई -जून 2013 के दौरान वाहनों का केन्...
Text Solution
|
- निम्न वृत्त -चित्र एक अभ्यर्थी द्वारा प्रदूषण जांच अभियान के द्वारा वि...
Text Solution
|
- निम्न वृत्त -चित्र एक अभ्यर्थी द्वारा प्रदूषण जांच अभियान के द्वारा वि...
Text Solution
|