


Similar Questions
Explore conceptually related problems
Recommended Questions
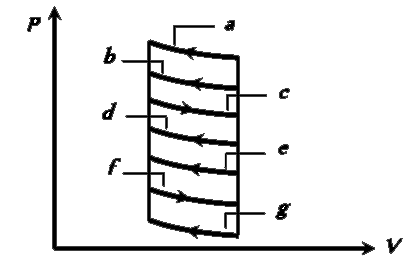
- The P - V diagram shows seven curved paths (connected by vertical path...
Text Solution
|
- Two moles of helium gas are taken over the cycle ABCDA, as shown in th...
Text Solution
|
- An ideal gas is taken around the cycle ABCA shown in P - V diagram. Th...
Text Solution
|
- The P - V diagram shows seven curved paths (connected by vertical path...
Text Solution
|
- An ideal gas is taken around the cycle ABCA as shown in P-V diagram. T...
Text Solution
|
- An ideal gas is taken around the cycle ABCA as shown in P-V diagram. T...
Text Solution
|
- Two moles of helium gas are taken over the cycle ABCDA, as shown in th...
Text Solution
|
- An ideal gas is taken around the cycle ABCA as shown in P-V diagram. T...
Text Solution
|
- The P -V diagram here shows six curved paths ( connected by vertical p...
Text Solution
|