


Similar Questions
Explore conceptually related problems
Recommended Questions
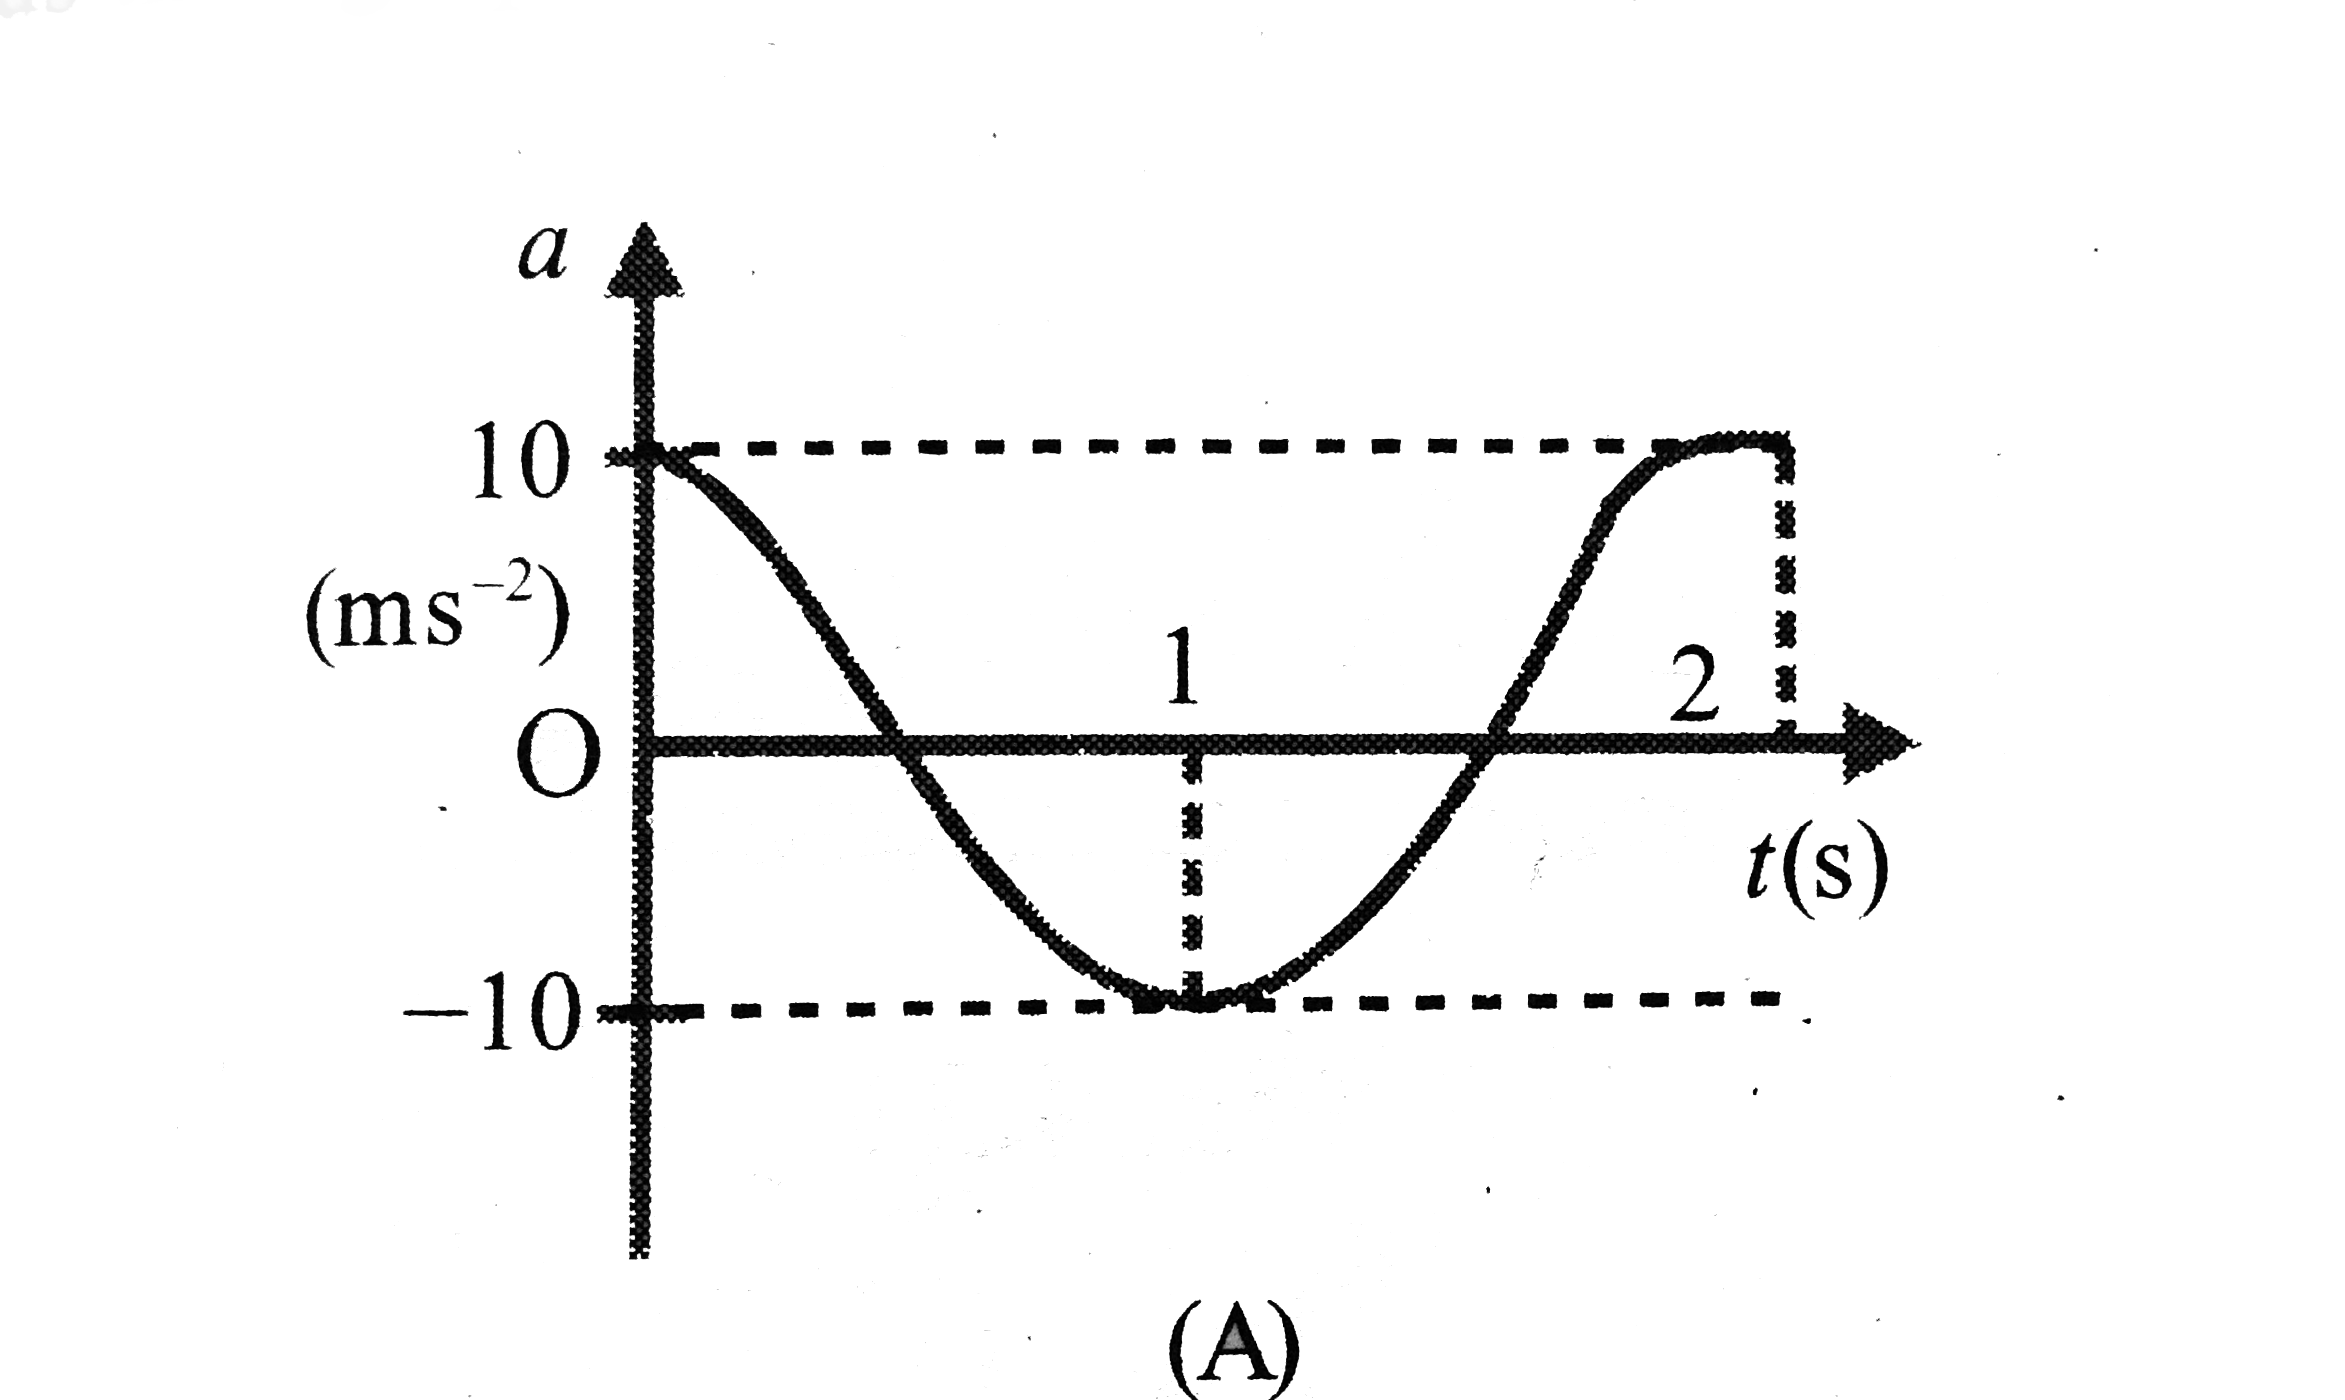
- i.The acceleration versus time graph of a partical SHM is shown in the...
Text Solution
|
- A partical executes SHM with an amplltude of 10 cm and friquency 2 Hz,...
Text Solution
|
- i.The acceleration versus time graph of a partical SHM is shown in the...
Text Solution
|
- A partical is performing SHM of amplitude 'A' and time period 't'. Fin...
Text Solution
|
- The adojoining diagram showns the velocity versus time plot for a part...
Text Solution
|
- The acceleration versus displacement graph of a particle performing SH...
Text Solution
|
- A partical is moving along the x-axis and its velocity-time graph is s...
Text Solution
|
- Acceleration a versus time t graph of a body in SHM is given by a curv...
Text Solution
|
- The following fighures show velocity v versus time t curves. But only ...
Text Solution
|