


Similar Questions
Explore conceptually related problems
Recommended Questions
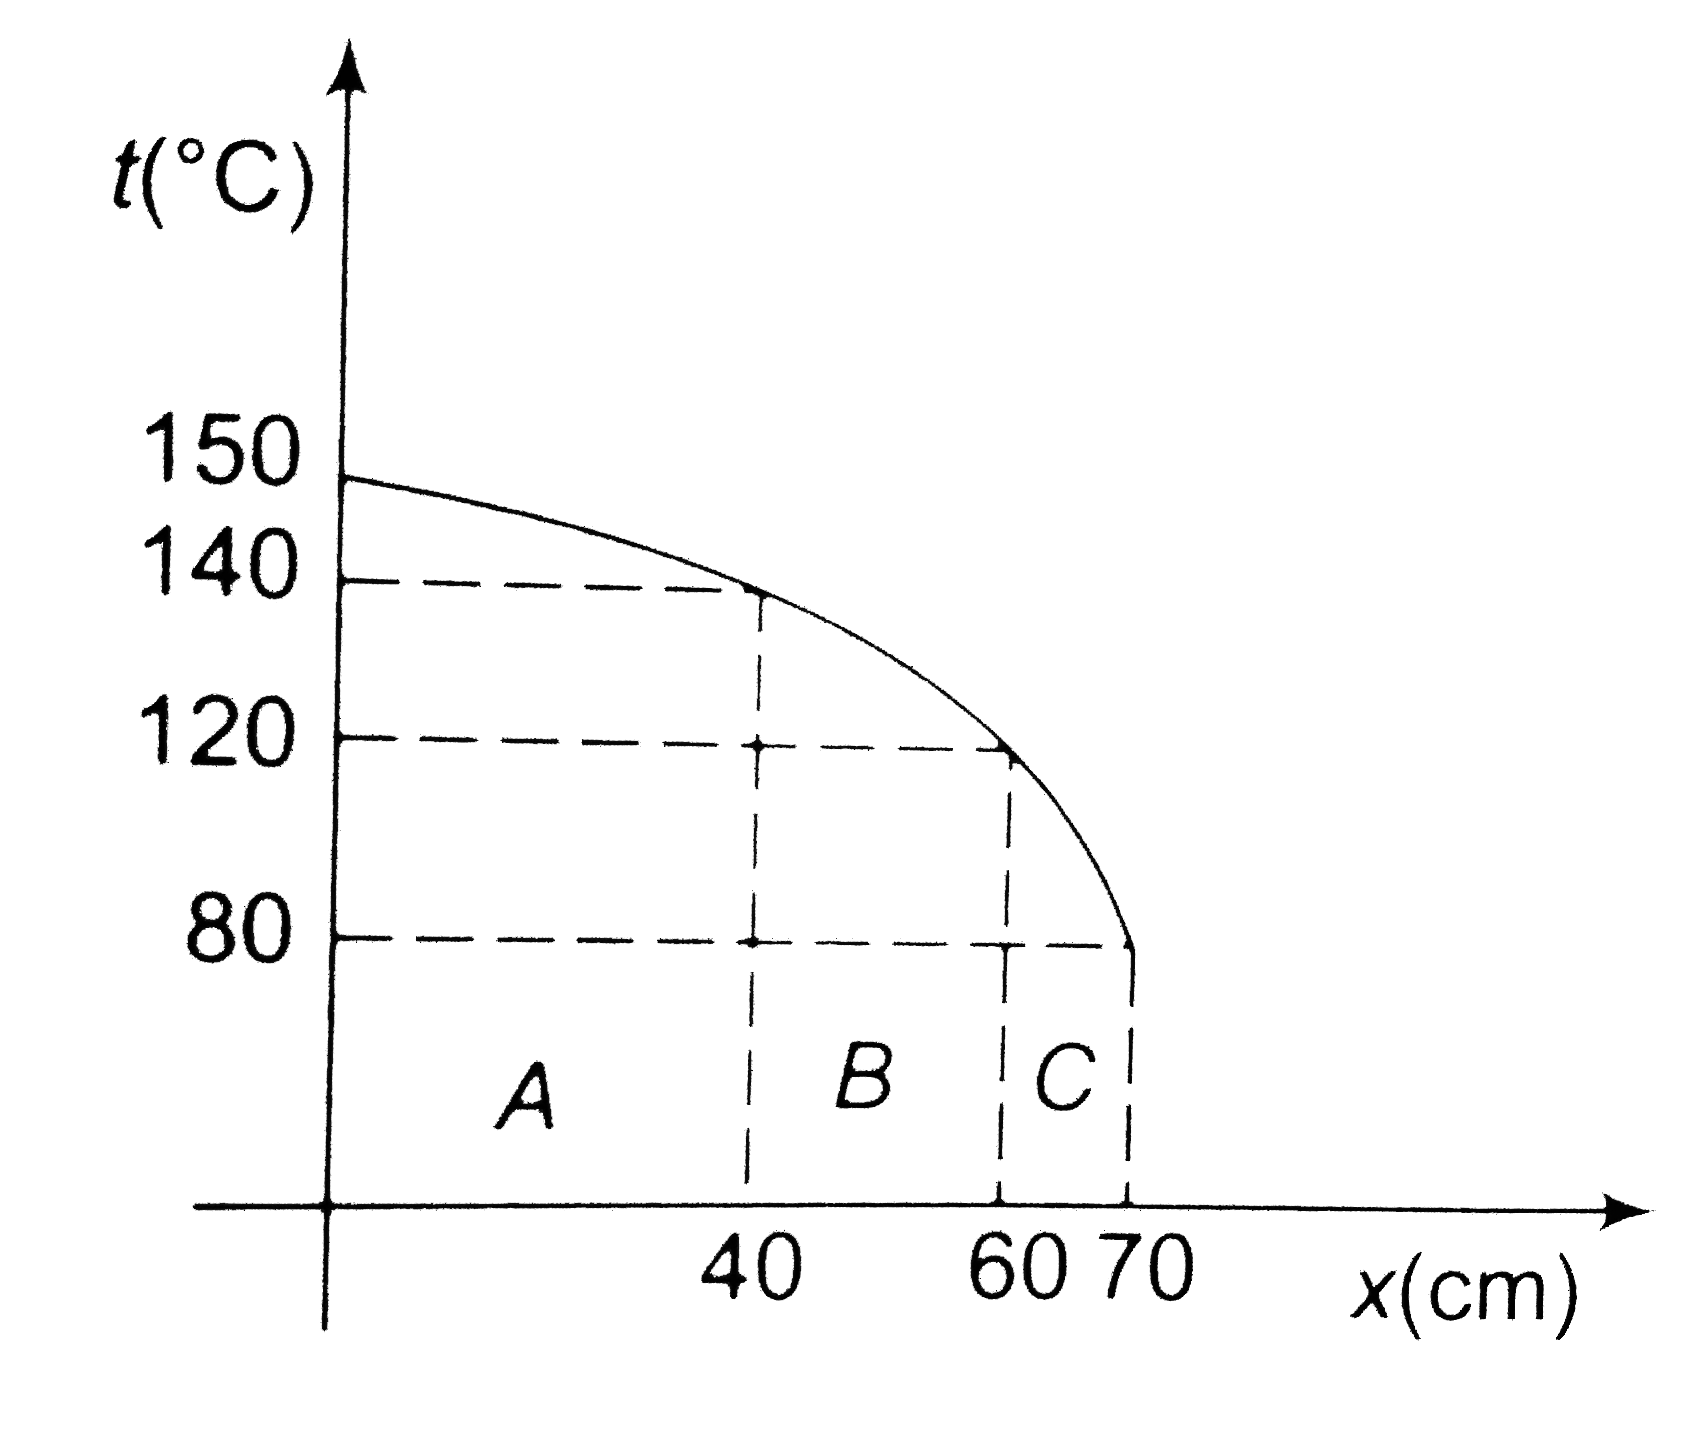
- The graph shown gives the temperature along an X axis that extends dir...
Text Solution
|
- A wall has two layers A and B, each made of different material. Both t...
Text Solution
|
- A wall has two layers A and B each made of different materials. The la...
Text Solution
|
- A wall has two layers A and B each made of different materials. The th...
Text Solution
|
- The graph shown gives the temperature along an X axis that extends dir...
Text Solution
|
- A wall consists of two layer, one of thickness 3 cm and other of 6 cm....
Text Solution
|
- A wall is made of equally thick layers 'P' and 'Q' of different materi...
Text Solution
|
- A wall has two layers A and B, each made of different materials. Both ...
Text Solution
|
- A wall is made of equally thick layers P and Q of different materials....
Text Solution
|