निर्देश :- केंद्र सरकार द्वारा अर्जित राजस्व वृत्त चार्ट (पाई चार्ट ) में दर्शाया गया है इस चार्ट का अध्ययन करे और निम्नलिखित 4 प्रश्नो के उत्तर दे ।
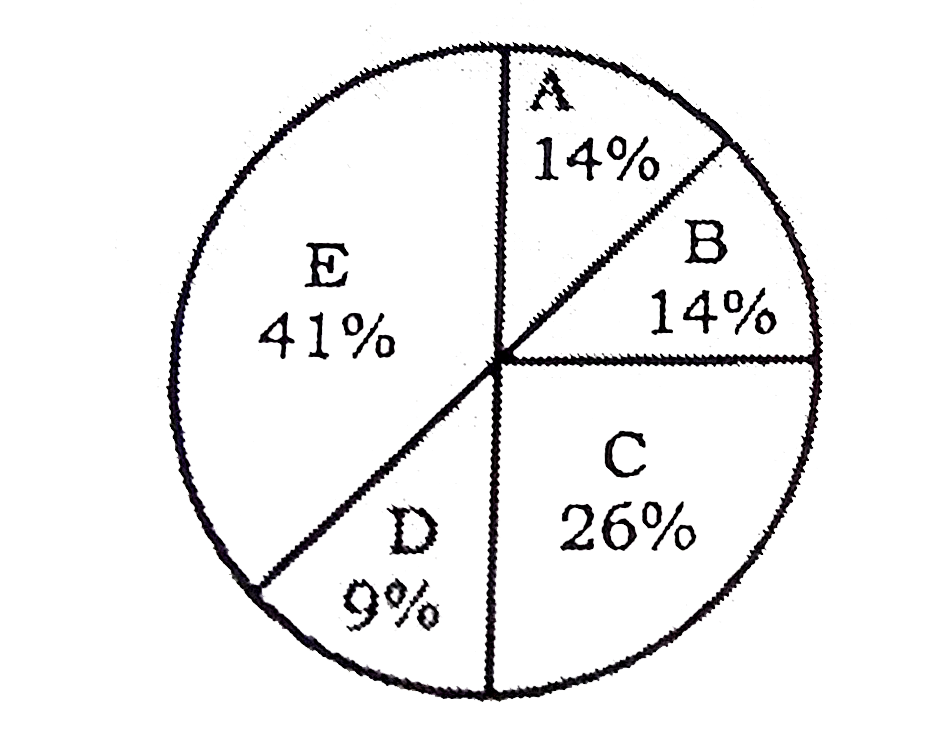
निर्देश :- केंद्र सरकार द्वारा अर्जित राजस्व वृत्त चार्ट (पाई चार्ट ) में दर्शाया गया है इस चार्ट का अध्ययन करे और निम्नलिखित 4 प्रश्नो के उत्तर दे ।


Similar Questions
Explore conceptually related problems
The following pie chart shows the monthly expenditure incurred by a family on various items, and their savings. Study the chart and answer the question that follows निम्नलिखित पाई चार्ट विभिन्न मदों पर एक परिवार द्वारा किए गए मासिक खर्च और उनकी बचत को दर्शाता है। चार्ट का अध्ययन करें और फिर पूछे गए प्रश्न का उत्तर दें। If the monthly income is ₹64,800, then the yearly savings are: यदि मासिक आय ₹64,800 है, तो वार्षिक बचत होती है:
The following pie chart shows the monthly expenditure incurred by a family on various items, and their savings. Study the chart and answer the question that follows निम्नलिखित पाई चार्ट विभिन्न मदों पर एक परिवार द्वारा किए गए मासिक खर्च और उनकी बचत को दर्शाता है। चार्ट का अध्ययन करें और फिर पूछे गए प्रश्न का उत्तर दें। If the expenditure on education is 2,700 more than that on housing, then the total expenditure on food and clothings is: यदि शिक्षा पर खर्च आवास से ₹2,700 अधिक है, तो भोजन और कपड़े पर कुल खर्च ज्ञात करे।
The given pie chart shows the marks obtained in an examination by a student (in degrees). Observe the pie chart and answer the question that follows: दिया गया पाई चार्ट एक छात्र द्वारा परीक्षा में प्राप्त अंकों (डिग्री में) को दर्शाता है। पाई चार्ट का निरीक्षण करें और निम्न प्रश्न का उत्तर दें: If total marks are 720, then the marks obtained in Chemistry, Biology and Maths together is what percentage of the total marks? यदि कुल अंक 720 हैं, तो रसायन विज्ञान, जीव विज्ञान और गणित में प्राप्त अंक कुल अंकों का कितना प्रतिशत है?
The given pie chart shows the marks obtained in an examination by a student (in degrees). Observe the pie chart and answer the question that follows: दिया गया पाई चार्ट एक छात्र द्वारा परीक्षा में प्राप्त अंकों (डिग्री में) को दर्शाता है। पाई चार्ट का निरीक्षण करें और निम्न प्रश्न का उत्तर दें: If the total marks are 720, then the marks obtained in English is what percentage of the marks obtained in Maths? यदि कुल अंक 720 हैं, तो अंग्रेजी में प्राप्त अंक गणित में प्राप्त अंकों का कितना प्रतिशत है?
The given pie chart shows the marks obtained in an examination by a student (in degrees). Observe the pie chart and answer the question that follows: दिया गया पाई चार्ट एक छात्र द्वारा परीक्षा में प्राप्त अंकों (डिग्री में) को दर्शाता है। पाई चार्ट का निरीक्षण करें और निम्न प्रश्न का उत्तर दें: If the total marks are 720, then the difference between the total marks obtained in Physics, Maths and Physical Education and the total marks in Chemistry, Biology and English out of the total marks is यदि कुल अंक 720 हैं, तो भौतिक विज्ञान, गणित और शारीरिक शिक्षा में प्राप्त कुल अंकों और कुल अंकों में से रसायन विज्ञान, जीवविज्ञान और अंग्रेजी में कुल अंकों के बीच का अंतर है:
The graph shows the monthly expenditure of a company (unit = 10 lakhs). Study the graph and answer the questions : The total monthly expenditure of the company is : ग्राफ में किसी कम्पनी के मासिक व्यय को दर्शाया गया है। ग्राफ का अध्ययन कीजिए और निम्नलिखित प्रश्नों के उत्तर दीजिए। कम्पनी का कुल मासिक व्यय कितना है ?
The following graph given the annual percent profit earned by a company during the period 1996-2001. Study the graph carefully and answer the questions that follow. % profit =(Income-Expenditure)/(Expenditure)xx100 निम्नलिखित आरेख 1996-2001 की अवधि के दौरान एक कंपनी के द्वारा अर्जित लाभ का वार्षिक प्रतिशत दर्शाता है। इस आरेख का ध्यानपूर्वक अध्ययन कीजिए और इसके बाद पूछे गए प्रश्नों का उत्तर दीजिए। The period in which the profit of the company has increased fastest is: वह अवधि जिसमें कंपनी का लाभ सबसे तेज़ी से बढ़ा है:
The given pie-chart, shows the percentage distribution of the expenditure incurred in publishing a book. Study the pie-chart and the answer the question based on it. / दिया गया पाई चार्ट किसी पुस्तक के प्रकाशन में हुए व्ययों के प्रतिशत वितरण को दर्शाता है | इस पाई चार्ट का अध्ययन करें तथा इस पर आधारित प्रश्न का उत्तर दें | In the given pie-chart, by what percentage the Royalty on the book is less than the Printing cost? / दिए गए पाई चार्ट के अनुसार, इस पुस्तक पर रॉयल्टी प्रकाशन की लागत से कितना प्रतिशत कम है ?
The graph shows the monthly expenditure of a company (unit = 10 lakhs). Study the graph and answer the questions : The ratio between transport and employee salary on monthly basis is ग्राफ में किसी कम्पनी के मासिक व्यय को दर्शाया गया है। ग्राफ का अध्ययन कीजिए और निम्नलिखित प्रश्नों के उत्तर दीजिए। मासिक आधार पर परिवहन और कर्मचारियों के वेतन के बीच अनुपात कितना है ?
The pie chart given below shows the expenditure on various items and savings of a family during the year 2009. Study the pie chart and answer these questions. नीचे दिया गया याई-चार्ट वर्ष २००९ में एक परिवार द्वारा विभिन्न मदों पर व्यय की गई धनराशि तथा बचत को प्रदर्शित करता है। पाईं-चार्ट का अध्ययन कीजिये तथा इस पर आधारित प्रश्नों का उत्तर दीजिये- Maximum expenditure of the family other than on food, was on परिवार द्वारा किसी मद पर भोजन के सिवाय सर्वाधिक व्यय किया गया?
Recommended Questions
- निर्देश :- केंद्र सरकार द्वारा अर्जित राजस्व वृत्त चार्ट (पाई चार्ट ) ...
Text Solution
|
- How many lines of symmetry does the above figure have ? <img src="http...
Text Solution
|
- Which of the following are correct chain isomers of butane ? (i) <img ...
Text Solution
|
- Determine the point of symmetry of a regular hexagon. <img src="htt...
Text Solution
|
- Dtermine the images of the following figure about the given line : ...
Text Solution
|
- Match the following Column A to Column B
Text Solution
|
- Match the following Column A to Column B
Text Solution
|
- Match the following Column A to Column B
Text Solution
|
- Find the area of the figure given below.
Text Solution
|