


Similar Questions
Explore conceptually related problems
Recommended Questions
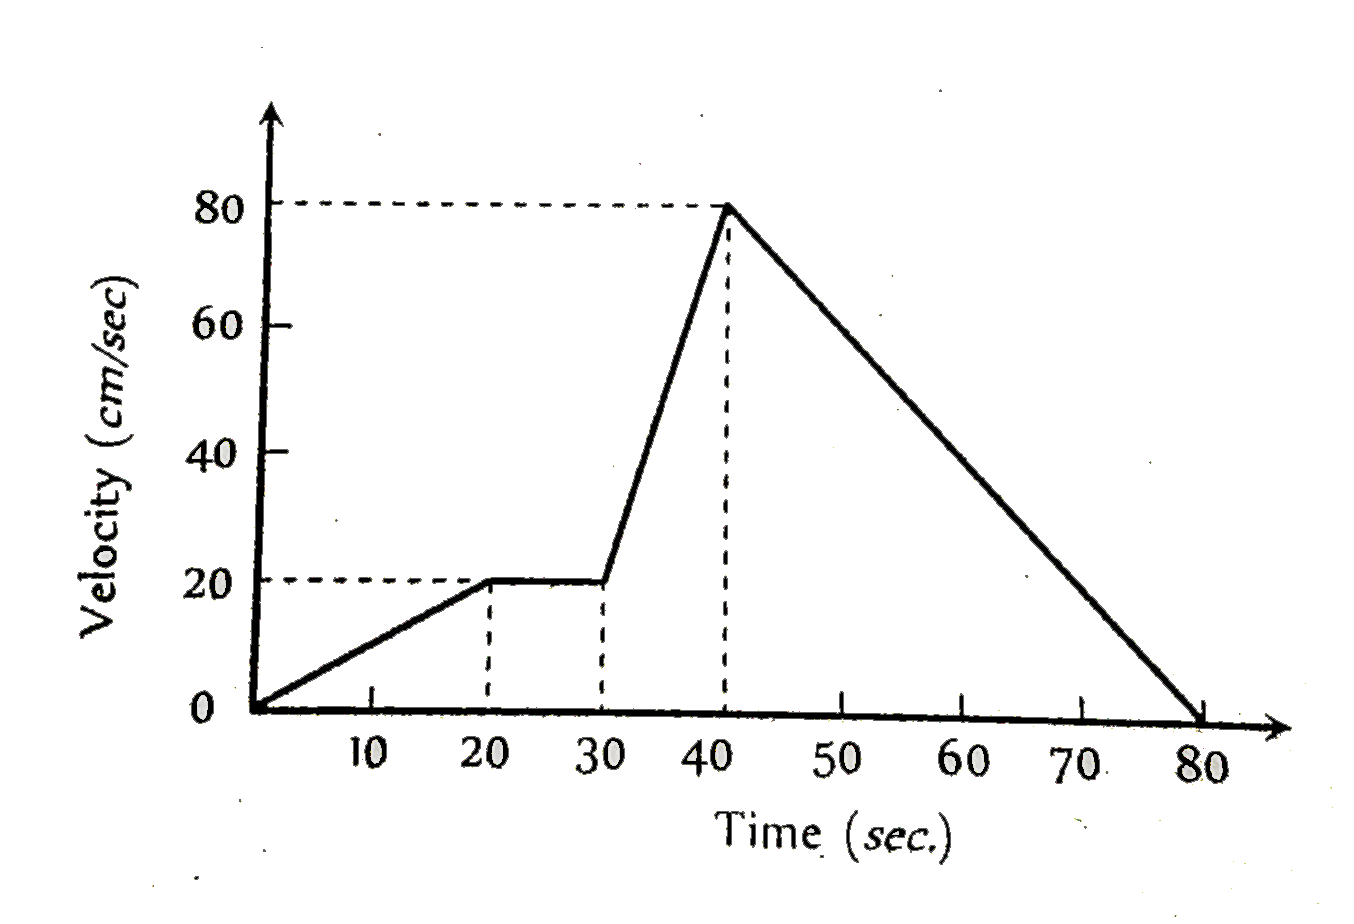
- The v -t graph of a moving object is given in figure. The maximum acce...
Text Solution
|
- From the given v - t graph (Figure), it can be inferred that the objec...
Text Solution
|
- The v -t graph of a moving object is given in figure. The maximum acce...
Text Solution
|
- The following shows the time-velocity graph for a moving object. The m...
Text Solution
|
- The velocity -time (v - t) graph of a particle moving in a straight li...
Text Solution
|
- From the given v-t graph (see figure), it can be inferred that the obj...
Text Solution
|
- Which of the following x-t graphs shows an object moving with negative...
Text Solution
|
- एक वस्तु का v - t ग्राफ संलग्न चित्र में प्रदर्शित किया गया है। उसके त...
Text Solution
|
- संलग्न चित्र में गतिमान वस्तु के लिए v - t ग्राफ प्रदर्शित किया गया है...
Text Solution
|