


Similar Questions
Explore conceptually related problems
Recommended Questions
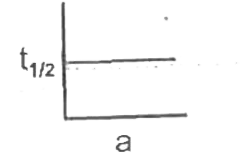
- The graph of t(1//2) versus initial concentration 'a' is for
Text Solution
|
- Figure shows graphs of pressure versus density for an ideal gas at two...
Text Solution
|
- Which of the following graphs formed plotted between t(1//2) and initi...
Text Solution
|
- In a first order reaction the graph between t(1//2) and concentration ...
Text Solution
|
- For a reaction , the graph obtained by plotting t(1//2) of the reactio...
Text Solution
|
- Draw the graph of half-life period ( t(1//2)) versus initial concentra...
Text Solution
|
- The graph plotted between concentration versus time
Text Solution
|
- The graph of t(1//2) versus initial concentration 'a' is for
Text Solution
|
- The following graph respresent the pressure versus number density for ...
Text Solution
|