


Similar Questions
Explore conceptually related problems
Recommended Questions
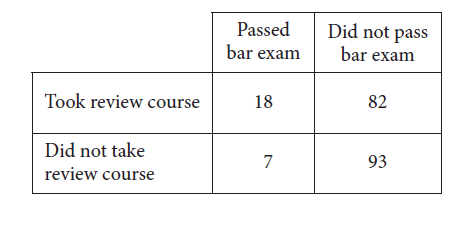
- Results on the Bar Exam of Law School Graduates The table above s...
Text Solution
|
- How many lines of symmetry does the above figure have ? <img src="http...
Text Solution
|
- In the figure given below, bar(ED)||bar(AB) and bar(EF)||bar(BC) . If ...
Text Solution
|
- Determine the point of symmetry of a regular hexagon. <img src="htt...
Text Solution
|
- In the figure above, bar(PQ) and bar(RS) are parallel. bar(AC) is tran...
Text Solution
|
- Match the following Column A to Column B
Text Solution
|
- Match the following Column A to Column B
Text Solution
|
- Match the following Column A to Column B
Text Solution
|
- The inequation represented by the graph given below is : <img src="htt...
Text Solution
|