


Similar Questions
Explore conceptually related problems
Recommended Questions
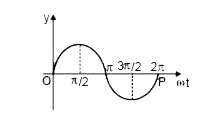
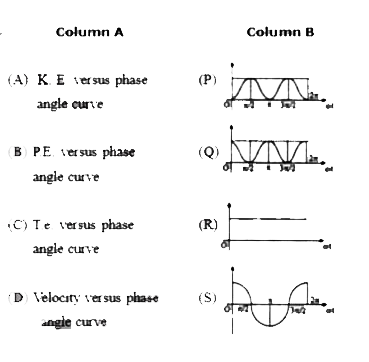
- The graph plotted between phase angle (phi) and displacement of a part...
Text Solution
|
- The velocity-displacement graph of a particle is shown in Fig. 2 (EP)....
Text Solution
|
- The graph plotted between acceleration and displacement of a particle ...
Text Solution
|
- A particle in SHM is located at different positions as shown below. Th...
Text Solution
|
- The displacement-time graph of a particle is as shown below. It indica...
Text Solution
|
- If a graph is plotted between velocity (v) and displacement (y) of a p...
Text Solution
|
- A graph between velocity and displacement of a particle performing SHM...
Text Solution
|
- The graph plotted between phase angle (phi) and displacement of a part...
Text Solution
|
- The graph plotted between phase angle (omega t) and displacement of a ...
Text Solution
|