


Similar Questions
Explore conceptually related problems
Recommended Questions
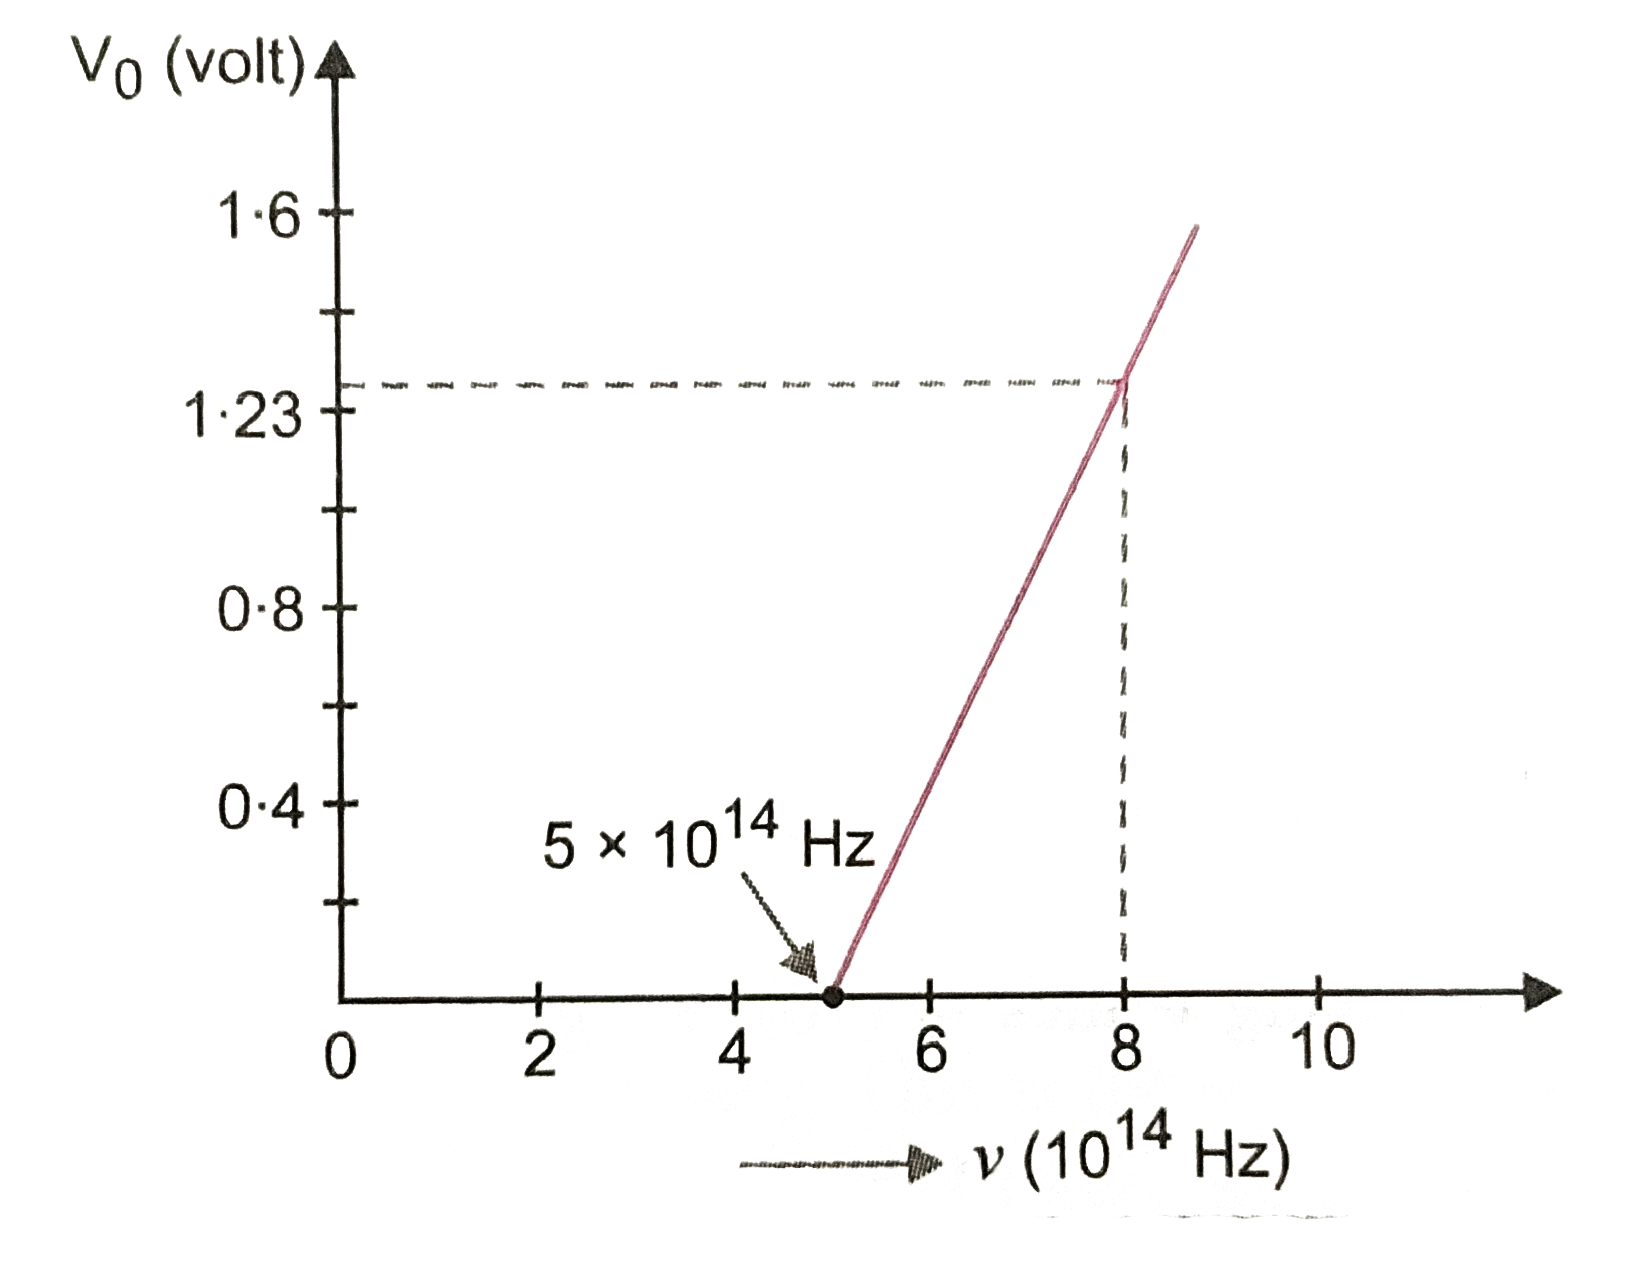
- Using the graph shown in fig for stopping potential vs the incident fr...
Text Solution
|
- Using the graph shown in fig for stopping potential vs the incident fr...
Text Solution
|
- Draw a graph showing the variation of stopping potential with frequenc...
Text Solution
|
- In photo electric effect, the slope of the straight line graph between...
Text Solution
|
- The stopping potential for acertain photosensitive metal is Vq when th...
Text Solution
|
- Graph of stopping potential for most energetic emitted photoelectron (...
Text Solution
|
- In a photoelectric experiment, the graph of frequency v of incident li...
Text Solution
|
- In photoelectric effect the slope of straight line graph between stopp...
Text Solution
|
- A light is incidence on a metallic surface. Graph etween stopping pote...
Text Solution
|