 .
.


Similar Questions
Explore conceptually related problems
Recommended Questions
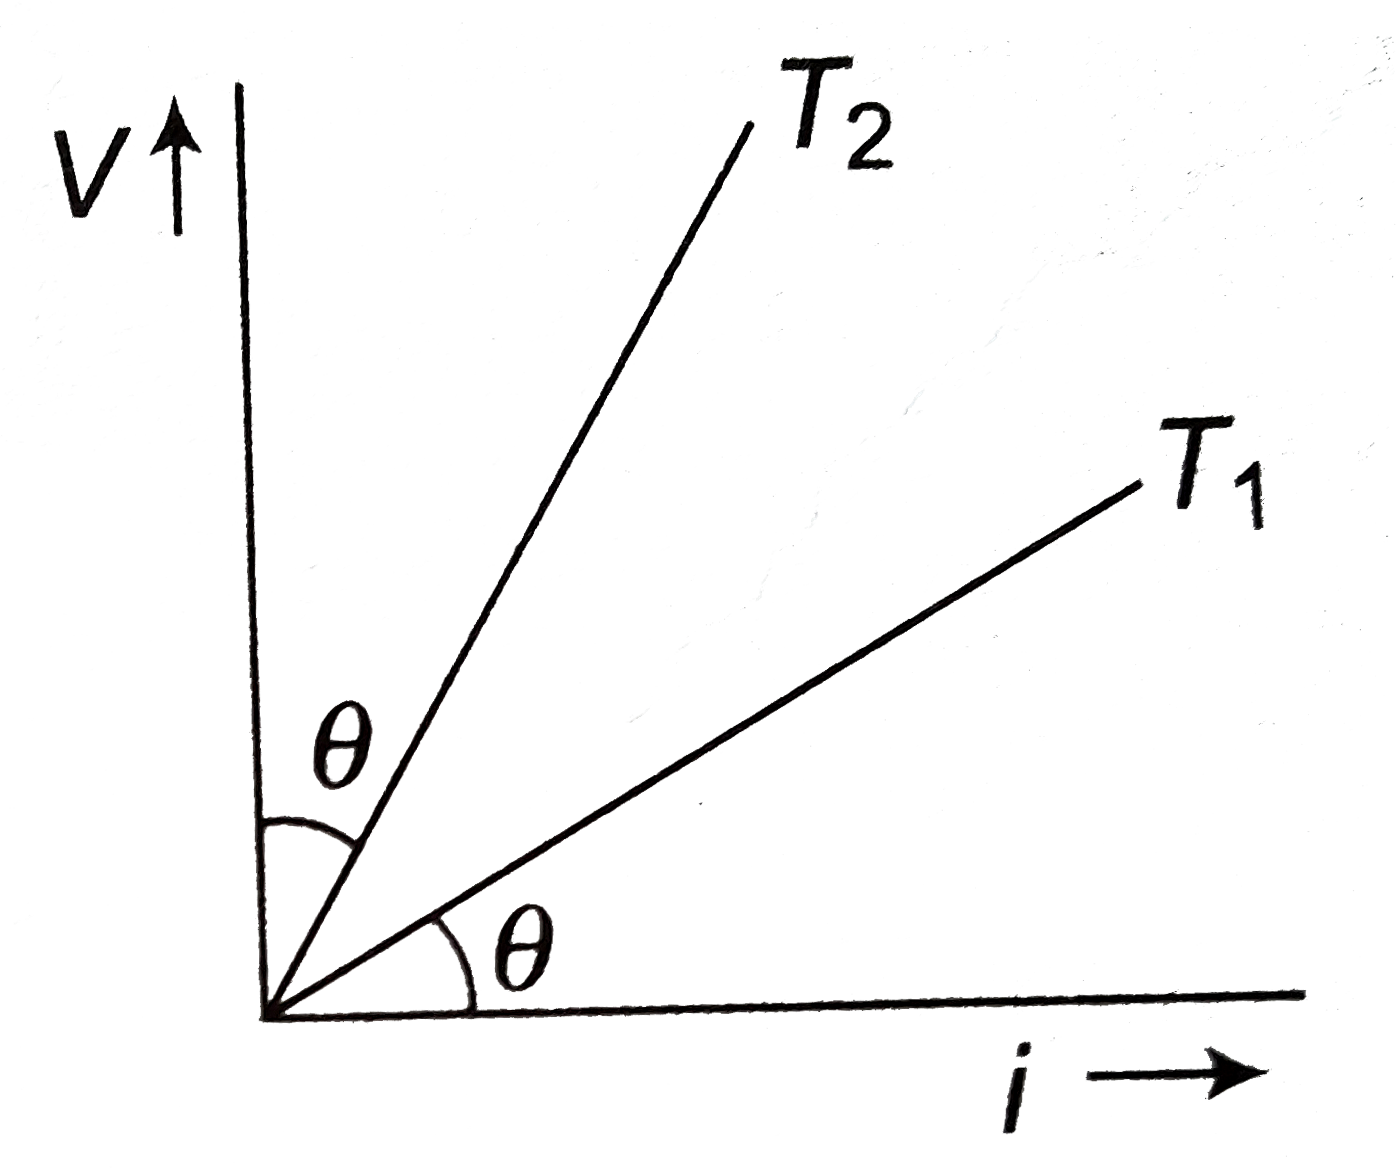
- The V-i graph for a conductor at temeratures T1 and T2 are as shown in...
Text Solution
|
- The current - voltage graphs for a given metallic wire at two differen...
Text Solution
|
- The V-i graph for a conductor at temeratures T1 and T2 are as shown in...
Text Solution
|
- The V - I graphs for a conductor at temperature T1 and T2 are shown in...
Text Solution
|
- ताप T1 तथा T2 (T2 gt T1) पर कृष्णिका विकिरण वक्र नीचे दिखाए गए है। इनम...
Text Solution
|
- V-I graph for a mettalic wire at two different temperatures T1 and T2 ...
Text Solution
|
- The VI graphs for a conductor at temperature T1 and T2 are shown in th...
Text Solution
|
- The current voltage graph for a given metallic conductor at two differ...
Text Solution
|
- The current - voltage graphs for a given metallic wire at two differen...
Text Solution
|