


Similar Questions
Explore conceptually related problems
Recommended Questions
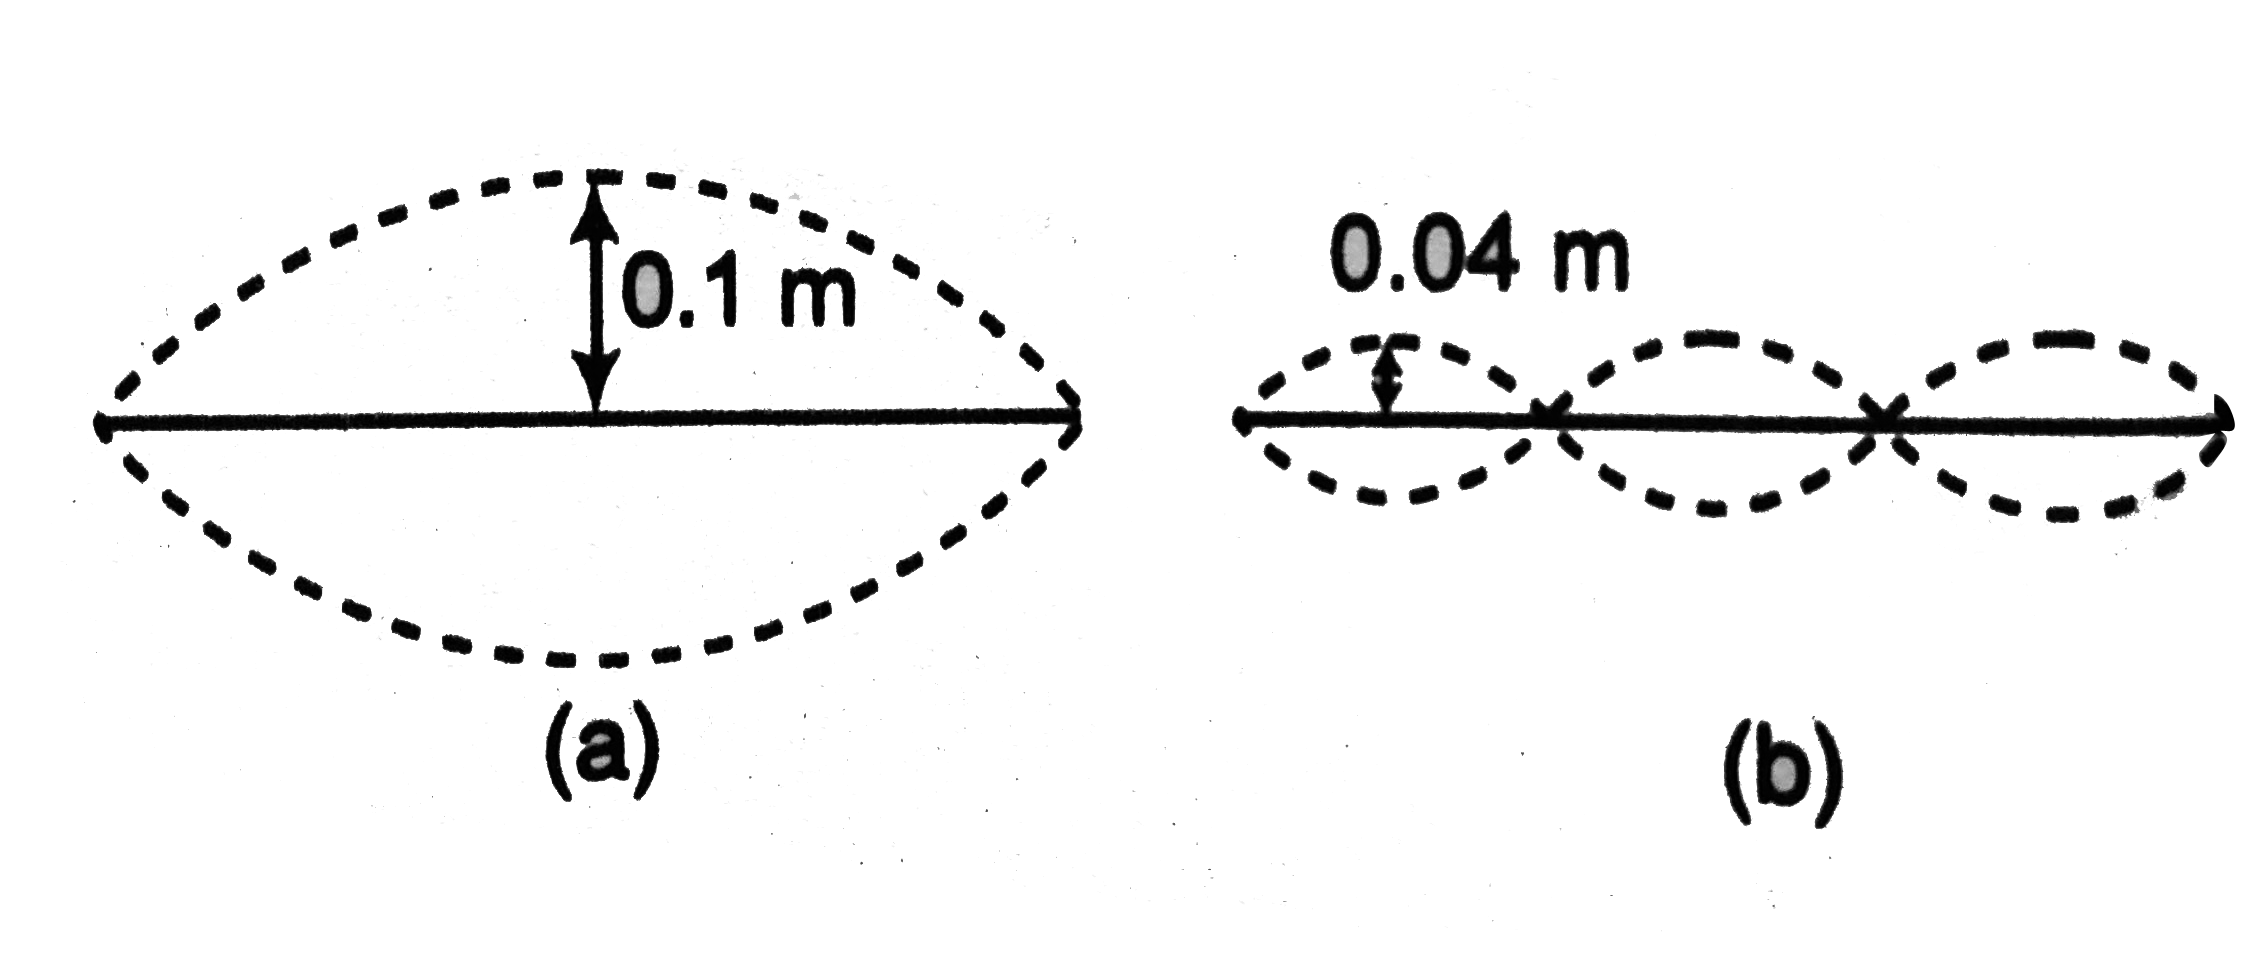
- Figure shows different standing wave patterns on a string of linear ma...
Text Solution
|
- The equation of a transverse wave propagating in a string is given by ...
Text Solution
|
- Figure shows different standing wave patterns on a string of linear ma...
Text Solution
|
- String I and II have identical and linear mass densities, but string I...
Text Solution
|
- A 2.0m long string with a linear mass density of 5.2xx10^(-3) kg m^(-1...
Text Solution
|
- Standing waves are produced on a string of length 2 m and of linear ma...
Text Solution
|
- A wire stretched between two rigid supports vibraes in its fundamental...
Text Solution
|
- Figure shows the standing waves pattern in a string at t = 0. Find out...
Text Solution
|
- Equation of standing waves in a string under tension T=10N is given by...
Text Solution
|