


Similar Questions
Explore conceptually related problems
Recommended Questions
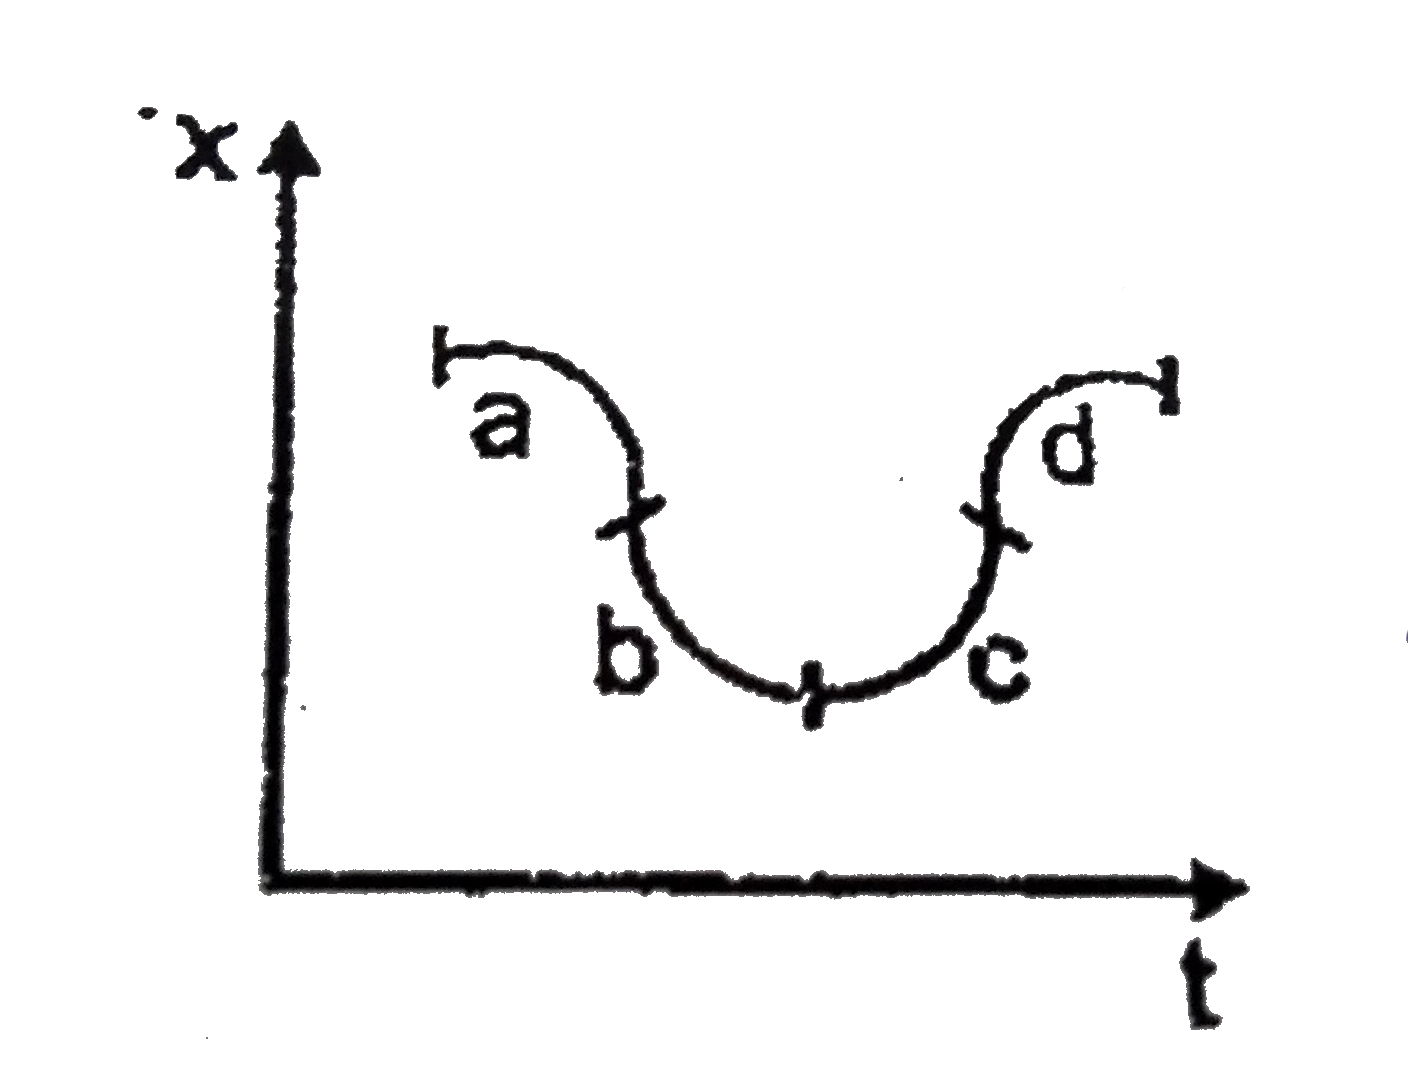
- The graph to the right is a plot of position versus time. For which la...
Text Solution
|
- The graph to the right is a plot of position versus time. For which le...
Text Solution
|
- The graph to the right is a plot of position versus time. For which la...
Text Solution
|
- Which graph corresponds to an object moving with a constant negative a...
Text Solution
|
- STATEMENT - 1 : All accelerated object are represented on position-tim...
Text Solution
|
- In the plot of concentration of reactant versus time, the tangent at a...
Text Solution
|
- The position time graph of a particle is shown below. The point where ...
Text Solution
|
- Position (x) versus time (t) graph of a particle is as shown. The velo...
Text Solution
|
- Position-time graph for motion with negative acceleration is :
Text Solution
|