


Similar Questions
Explore conceptually related problems
Recommended Questions
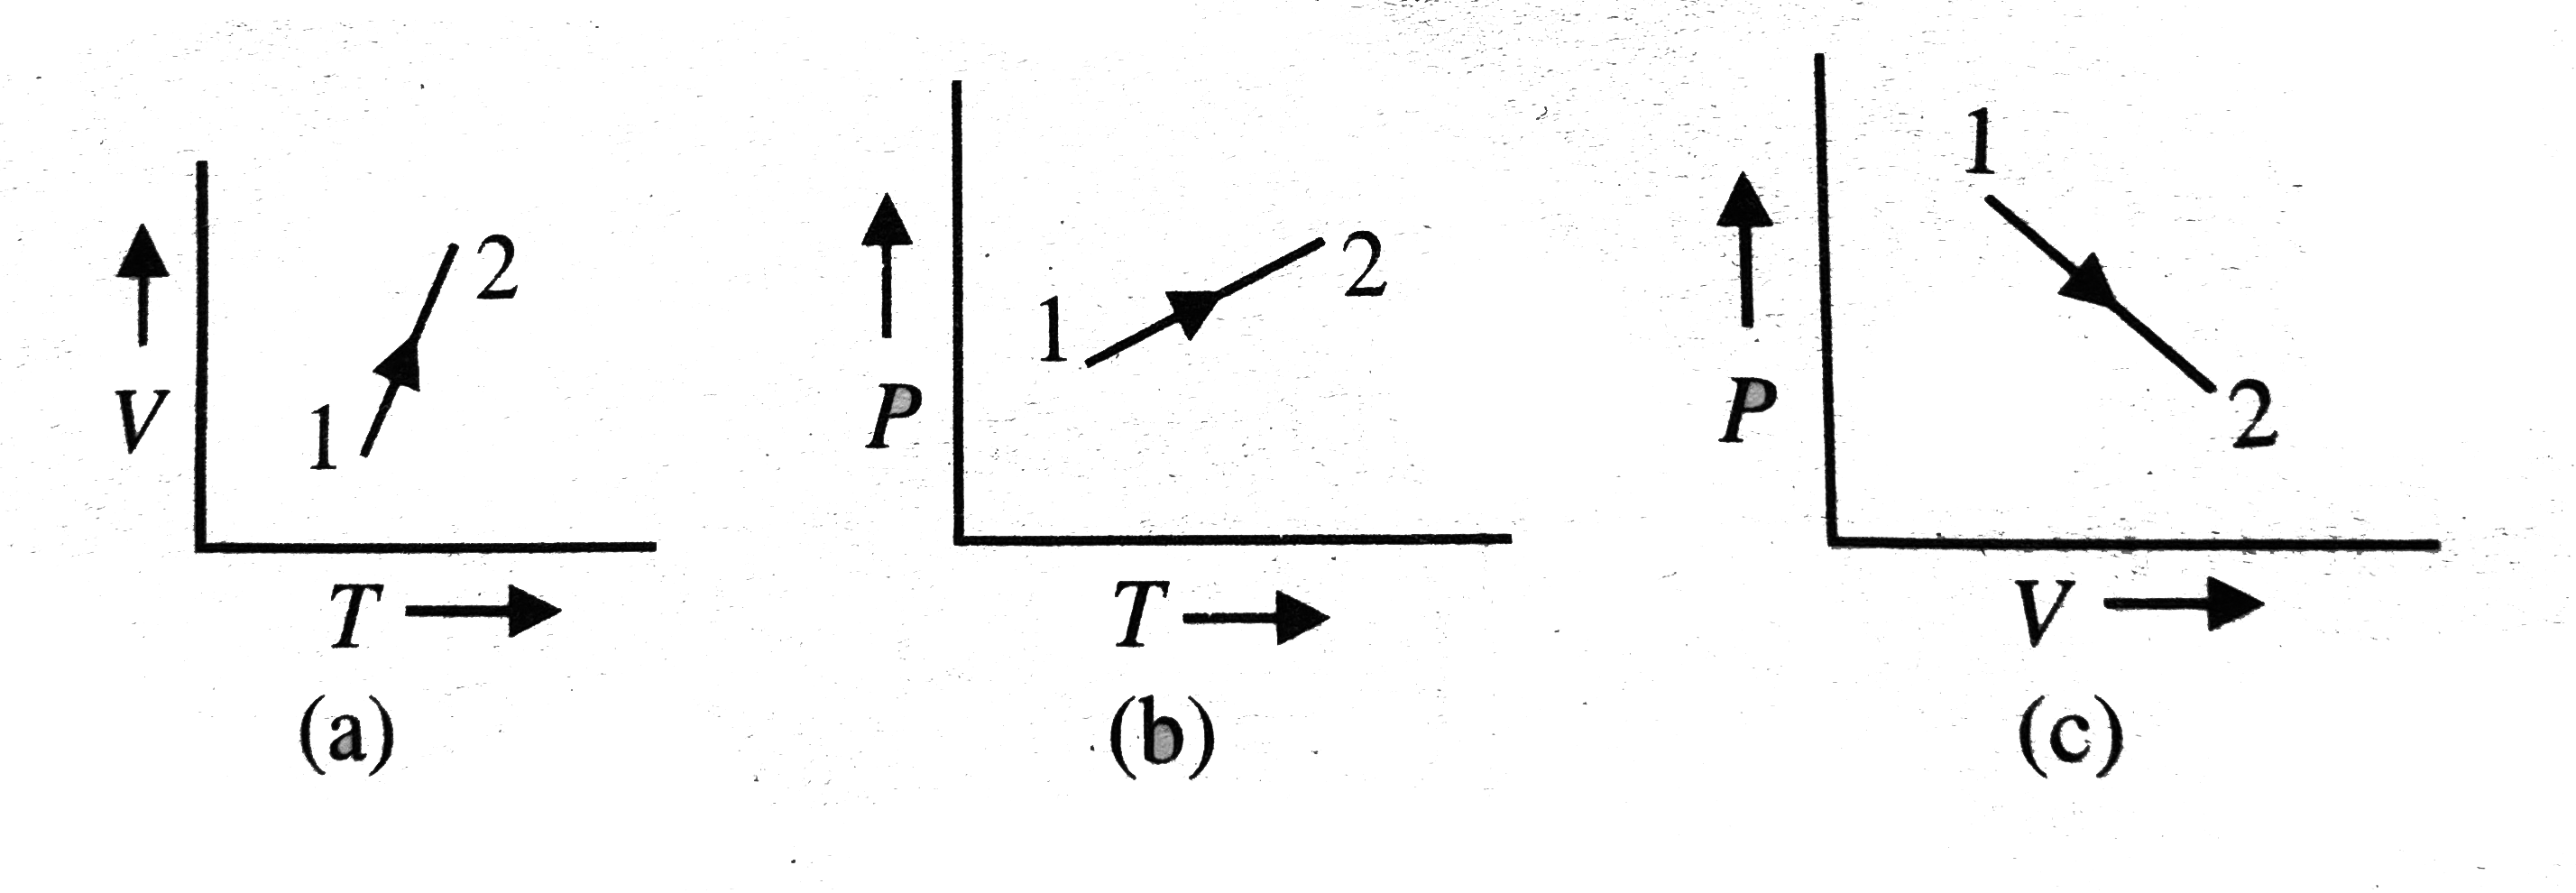
- The three diagrams below depict three different processes for a given ...
Text Solution
|
- The three diagrams below depict three different processes for a given ...
Text Solution
|
- An ideal gas undergoes an expansion from a state with temperature T(1)...
Text Solution
|
- For given mass of an ideal gas, consider the following diagrams What i...
Text Solution
|
- V-T diagram for a process of given mass of ideal gas is as shown in fi...
Text Solution
|
- An ideal gas change from state a to state b as shown in Fig. what is t...
Text Solution
|
- The figures given below depict different processes for a given amount...
Text Solution
|
- The volume-temperature graphs of a given mass of an ideal gas at const...
Text Solution
|
- The p-T graph for the given mass of an ideal gas is shown in figure. W...
Text Solution
|