


Similar Questions
Explore conceptually related problems
Recommended Questions
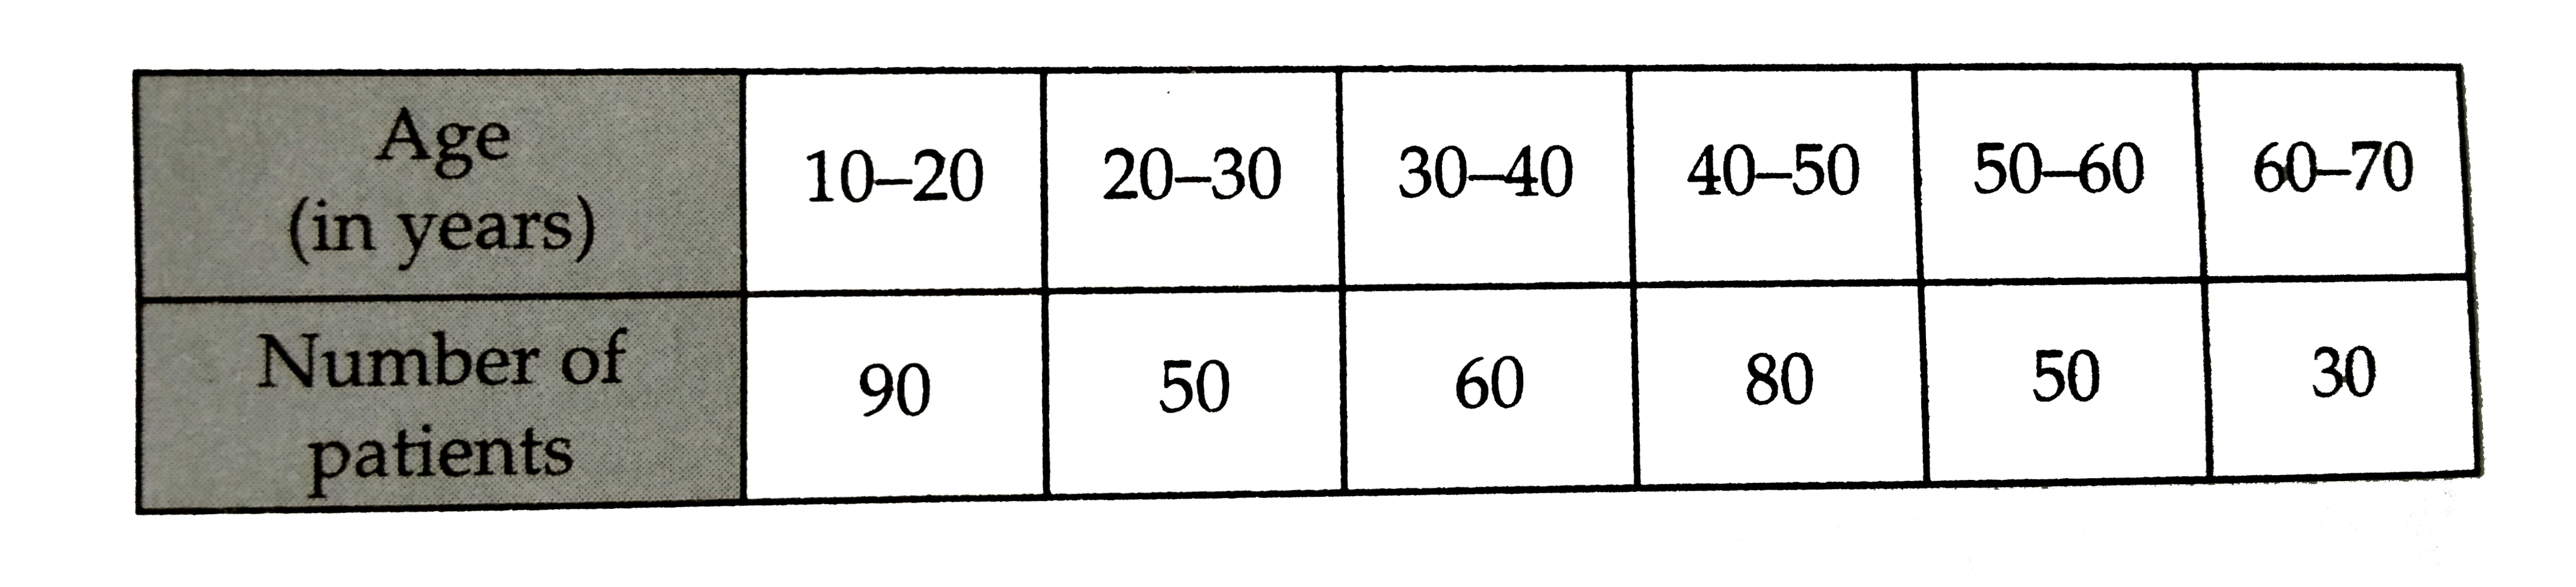
- Following are the ages (in years) of 360 patients , getting medical tr...
Text Solution
|
- In a family,father's age is 3 years more than 3 xx of son's age.Mother...
Text Solution
|
- The present age of A is 4 years less than twice the present age of B. ...
Text Solution
|
- The cost of living index for the year 2007, considering the year 2000...
Text Solution
|
- The age of a father is 25 years more than his son's age. The product o...
Text Solution
|
- Following are the ages (in years) of 360 patients , getting medical tr...
Text Solution
|
- వేర్ల ద్వారా శాఖీయోత్పత్తి జరిపే మొక్కbr i) డాలియాbr ii) ముల్లంగ...
Text Solution
|
- A की उम्र B की उम्र से 10 वर्ष अधिक है और दोनों की उम्रो का जोड़ 70 वर्...
Text Solution
|
- The present age of A is 4 years less than twice the present age of B. ...
Text Solution
|