


Similar Questions
Explore conceptually related problems
Recommended Questions
- Graph between pressure and volume are plotted at different temperature...
Text Solution
|
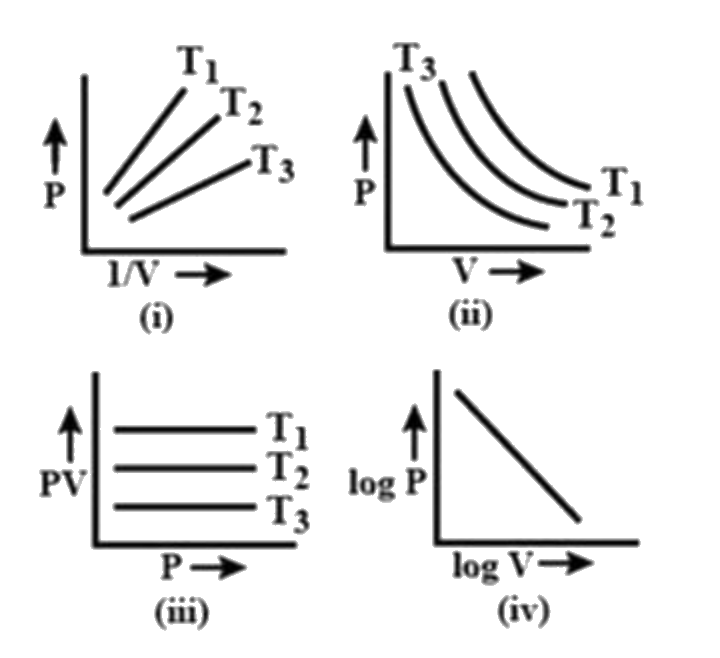
- Which of the following plots does not represent Boyle's law?
Text Solution
|
- Graphs between pressure and volume are plotted at different temperatur...
Text Solution
|
- Which one of the given pressure versus volume plots represents Boyle's...
Text Solution
|
- Graph between pressure and volume are plotted at different temperature...
Text Solution
|
- A graph is plotted between pressure and volume at different temperatur...
Text Solution
|
- According to Boyle's law, the shape of the graph between pressure and ...
Text Solution
|
- बॉयल के नियम से, किसी नियत ताप पर यदि किसी गैस का दाब दोगुना कर दें तो...
Text Solution
|
- Graphs between pressure and volume are drawn at different temperatures...
Text Solution
|