


Similar Questions
Explore conceptually related problems
Recommended Questions
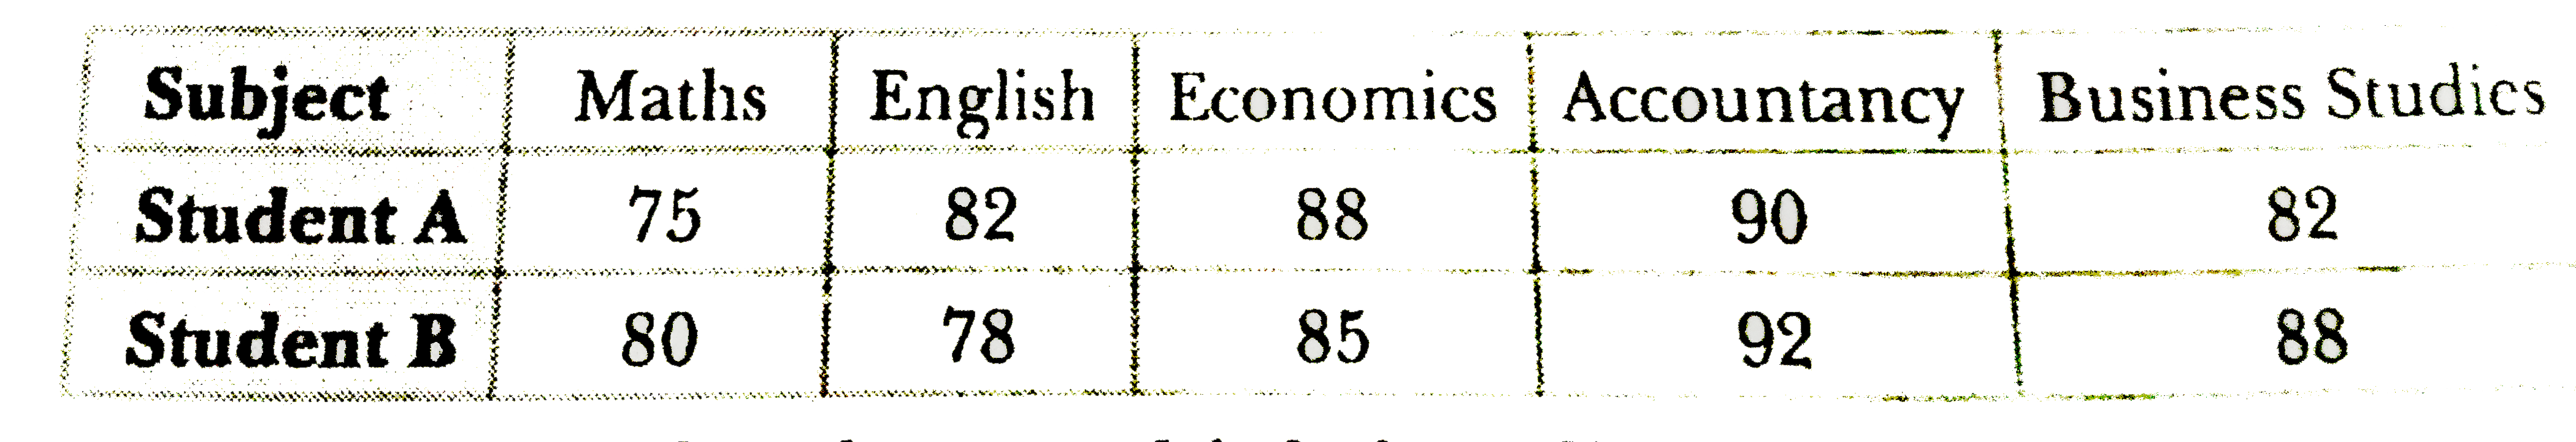
- The following table gives the data on the marks obtained by two studen...
Text Solution
|
- क्लोरोबेंजीन की क्रिया क्यूप्रस ऑक्साइड की उपस्थिति में अमोनिया से करा...
Text Solution
|
- निम्न पर संक्षिप्त टिप्पणी लिखिए! (a) प्रायंस ! (b) इंटरफेरॉन (c) वा...
Text Solution
|
- निचे दिए परिपथ में A और B के बिच तुल्य प्रतिरोध ज्ञात कीजिए ।
Text Solution
|
- पाच वर्ष पूर्व, A की आयु B से तीन गुनी थी तथा दस वर्ष बाद A की आयु B स...
Text Solution
|
- एक कक्षा के छात्रों को पंक्ति में खड़ा किया जाता है। यदि प्रत्येक पंक्...
Text Solution
|
- समस्याओ में रैखिक समीकरणो के युग्म बनाइए और अनके हल ( यदि उनक...
Text Solution
|
- (x)/(a) - (y)/(b) = 0" "ax + by = a^(2) + b^(2) रेखिक समीकरणो ...
Text Solution
|
- हल कीजिए: (ax)/(b) - (by)/(a) = a+b और ax - by = 2ab
Text Solution
|