


Similar Questions
Explore conceptually related problems
Recommended Questions
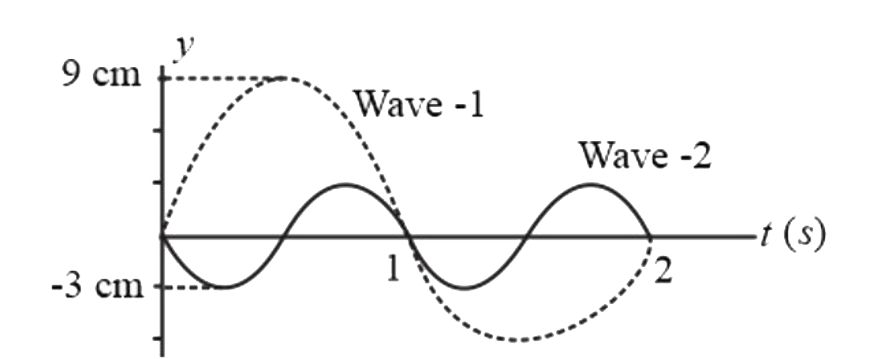
- Displacement - time graphs for two waves, wave - 1 and wave - 2 are sh...
Text Solution
|
- The displacement time graph for two sound waves A and B are shown in t...
Text Solution
|
- The ratio of amplitude of two waves is 2:3 . What is the ration of int...
Text Solution
|
- दो तरंगो की तीव्रताओं का अनुपात 1:9 है। यदि दोनों तरंगे व्यतिकरण करती ...
Text Solution
|
- दो तरंगों की तीव्रताओं का अनुपात 1:9 है। तरंगों में व्यतिकरण से अधिकतम...
Text Solution
|
- दो तरंगों का तीव्रताओं का अनुपात 1 : 9 हें | यदि ये दोनों तरंगे व्यति...
Text Solution
|
- दो तरंगों को तीव्रताओं का अनुपात 1 : 25 है । यदि ये दोनो तरंगे व्यतिक...
Text Solution
|
- Displacement - time graphs for two waves, wave - 1 and wave - 2 are sh...
Text Solution
|
- The ratio of the amplitude of displacement of two equal intensity soun...
Text Solution
|