 .
.


Similar Questions
Explore conceptually related problems
Recommended Questions
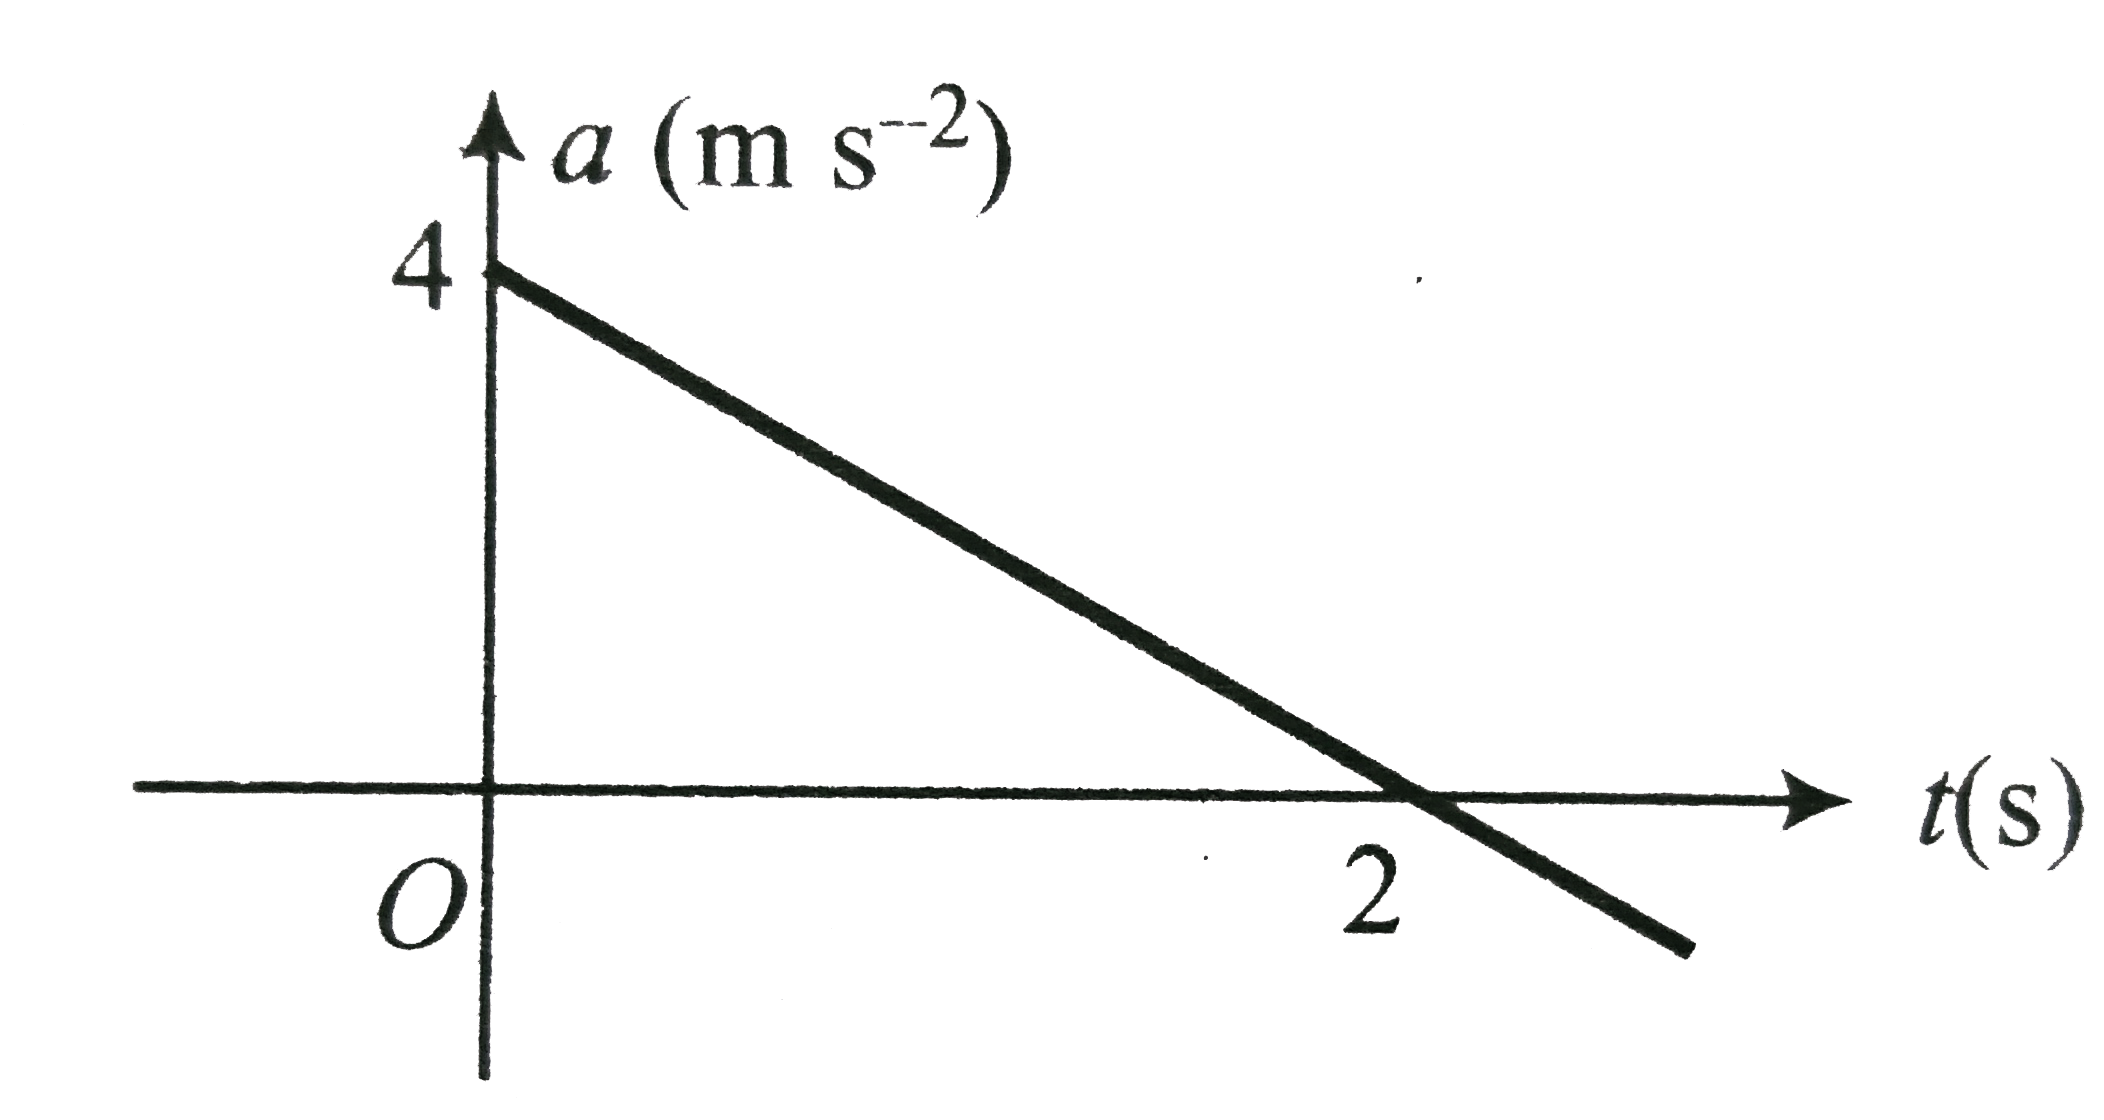
- The acceleration versus time graph of a particle moving in a straight ...
Text Solution
|
- The acceleration versus time graph of a particle moving in a straight ...
Text Solution
|
- The acceleration-time graph of a particle moving along a straight line...
Text Solution
|
- Velocity versus displacement graph of a particle moving in a straight ...
Text Solution
|
- Velocity versus displacement graph of a particle moving in a straight ...
Text Solution
|
- For a particle moving on a straight lint the variation of acceleration...
Text Solution
|
- A particle starts to move along a straight line. The acceleration vers...
Text Solution
|
- The kinetic energy (KE) versus time graph for a particle moving along ...
Text Solution
|
- Acceleration versus velocity graph of a particle moving in a straight ...
Text Solution
|