निम्नलिखित पाई -चार्ट में विभीनन व्यवसायों को प्रतिशत दर्शाया गया है। पाई - चार्ट का ध्यानपूर्वक अध्ययन कीजिये और प्रशन संख्या 485 से 488 का उतर दीजिये। लोगो की कुल संख्या =20000,
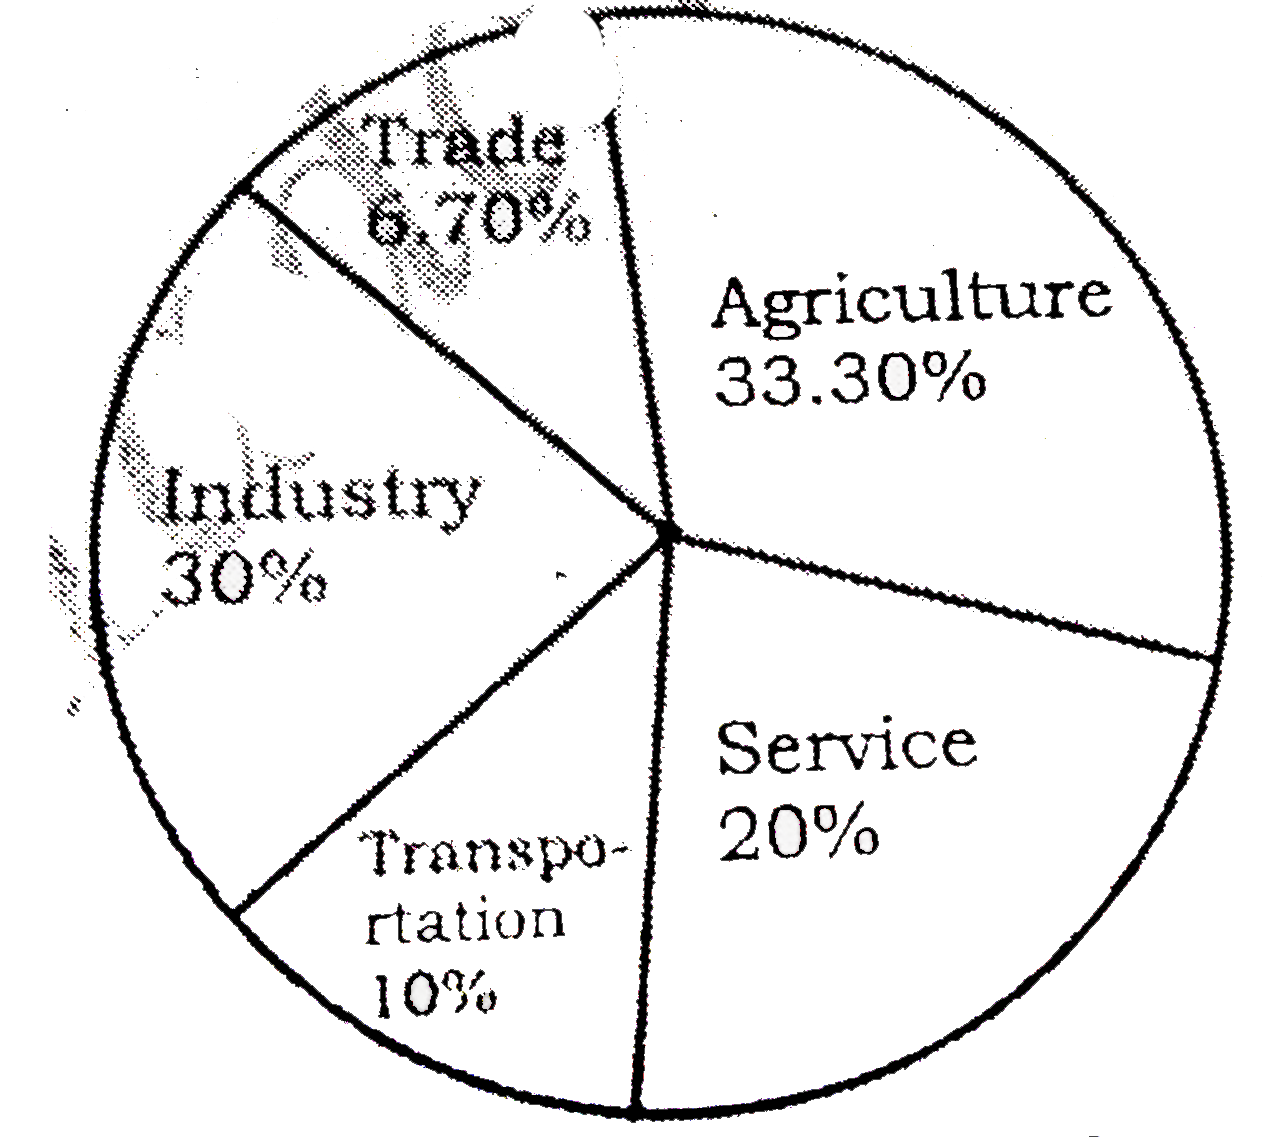
दिए गए पाई -चार्ट में सेवा में शामिल लोगो द्वारा बना त्रिज्या कोण कितने अंश का है?
निम्नलिखित पाई -चार्ट में विभीनन व्यवसायों को प्रतिशत दर्शाया गया है। पाई - चार्ट का ध्यानपूर्वक अध्ययन कीजिये और प्रशन संख्या 485 से 488 का उतर दीजिये। लोगो की कुल संख्या =20000,
दिए गए पाई -चार्ट में सेवा में शामिल लोगो द्वारा बना त्रिज्या कोण कितने अंश का है?
दिए गए पाई -चार्ट में सेवा में शामिल लोगो द्वारा बना त्रिज्या कोण कितने अंश का है?


Similar Questions
Explore conceptually related problems
The following pie-chart shows the monthly expenditure of a family on various items. If the family spends Rs. 825 on clothing, answer the question. निम्नलिखित पाई-चार्ट में किसी परिवार के विभिन्न मदों पर होने वाले खर्च का दर्शाया गया है। यदि परिवार वस्त्रों पर 825 रू खर्च करे तो प्रश्न का उत्तर दीजिए। What percent of the total income does the family save? परिवार में कुल आय को कितनी प्रतिशत राशि की बचत की जाती है?
The given pie chart shows the percentage distribution of 450 employees in an organization. Study the pie chart and answer the questions that follow दिए गए पाई चार्ट एक संगठन में 450 कर्मचारियों के प्रतिशत को दर्शाता है। पाई चार्ट का अध्ययन करें और आने वाले प्रश्नों का उत्तर दें। What is the central angle of the sector representing the number of employees in department A? विभाग A में कर्मचारियों की संख्या का प्रतिनिधित्व करने वाले क्षेत्र का केंद्रीय कोण क्या है?
The given table represents the number of engineers recruited by four companies A,B,C and D over the years. Study the table carefully and answer the questions that follows:The total number of engineers recruited by company A in 2014 to 2017 is what percentage more than the total number of engineers recruited by all the four companies in 2019? दी गयी तालिका चार कंपनियों A, B, C और D के द्वारा इन वर्षों के दौरान भर्ती किये गए इंजीनियरों की संख्या दर्शाती है | इस तालिका का ध्यानपूर्वक अध्ययन करें तथा इसके बाद पूछे गए प्रश्न का उत्तर दें | कंपनी A के द्वारा 2014 से 2017 की अवधि में भर्ती किये गए इंजीनियरों की कुल संख्या सभी चार कंपनियों के द्वारा 2019 में भर्ती किये गए इंजीनियरों की कुल संख्या से कितना प्रतिशत अधिक है ?
The given table represents the number of engineers recruited by four companies A,B,C and D over the years. Study the table carefully and answer the questions that follows: The total number of engineers recruited by the company B in 2014 and 2017 is what percentage of the total number of engineers recruited by C during 2015 to 2019? दी गयी तालिका चार कंपनियों A, B, C और D के द्वारा इन वर्षों के दौरान भर्ती किये गए इंजीनियरों की संख्या दर्शाती है | इस तालिका का ध्यानपूर्वक अध्ययन करें तथा इसके बाद पूछे गए प्रश्न का उत्तर दें | कंपनी B के द्वारा 2014 और 2017 में भर्ती किये गए इंजीनियरों की कुल संख्या C के द्वारा 2015 से 2019 के दौरान भर्ती किये गए इंजीनियरों की कुल संख्या का कितना प्रतिशत है ?
The following pie-chart shows the monthly expenditure of a family on various items. If the family spends Rs. 825 on clothing, answer the question. निम्नलिखित पाई-चार्ट में किसी परिवार के विभिन्न मदों पर होने वाले खर्च का दर्शाया गया है। यदि परिवार वस्त्रों पर 825 रू खर्च करे तो प्रश्न का उत्तर दीजिए। What is the ratio of expenses on food and miscellaneous ? भोजन और विविध मदों पर होने वाले खर्च के बीच का क्या अनुपात है?
The given pie-chart depicts the percentage of students coming to school using different modes of transport. Total number of students=1300 दिया गया पाई चार्ट परिवहन के विभिन्न साधनों का प्रयोग करके विद्यालय आने वाले छात्रों का प्रतिशत दर्शाता है | छात्रों की कुल संख्या =1300 In the given pie-chart, if 234 students used to walk, then how many come by bus ? / दिए गए पाई-चार्ट में, यदि 234 छात्र चलकर आते हैं, तो कितने छात्र बस से आते हैं?
The following pie chart shows the monthly expenditure incurred by a family on various items, and their savings. Study the chart and answer the question that follows निम्नलिखित पाई चार्ट विभिन्न मदों पर एक परिवार द्वारा किए गए मासिक खर्च और उनकी बचत को दर्शाता है। चार्ट का अध्ययन करें और फिर पूछे गए प्रश्न का उत्तर दें। If the monthly income is ₹64,800, then the yearly savings are: यदि मासिक आय ₹64,800 है, तो वार्षिक बचत होती है:
The following pie chart shows percentage expenditure of a country on different heads. The total expenditure is Rs.1,680 (in billions). Study the chart and answer the questions निम्नलिखित पाई चार्ट अलग-अलग प्रमुखों पर किसी देश का प्रतिशत व्यय दर्शाता है। कुल खर्च रु1,680 (अरबों में)। चार्ट का अध्ययन करें और प्रश्नों का उत्तर दें | The central angle of the sector representing expenditure on subsidy is : सब्सिडी पर व्यय का प्रतिनिधित्व करने वाले क्षेत्र का केंद्रीय कोण ज्ञात करे |
The pie-chart shows percentage-wise distribution of teachers who teach six different subjects. Study the pie chart and answer the questions पाई-चार्ट छह अलग-अलग विषयों को पढ़ाने वाले शिक्षकों के प्रतिशत को दर्शाता है। पाई चार्ट का अध्ययन करें और प्रश्नों के उत्तर दें। Total number of teachers = 1650 शिक्षकों की कुल संख्या - 1650 What is the total number of teachers teaching English, Maths and Physics? अंग्रेजी, गणित और भौतिकी पढ़ाने वाले शिक्षकों की कुल संख्या क्या है?
The given pie chart shows the percentage distribution of 450 employees in an organization. Study the pie chart and answer the questions that follow दिए गए पाई चार्ट एक संगठन में 450 कर्मचारियों के प्रतिशत को दर्शाता है। पाई चार्ट का अध्ययन करें और आने वाले प्रश्नों का उत्तर दें। If 75% of the employees in department D are males, how many female employees are there in that department ? यदि विभाग D में 75% कर्मचारी पुरुष हैं, तो उस विभाग में कितनी महिला कर्मचारी हैं
Recommended Questions
- निम्नलिखित पाई -चार्ट में विभीनन व्यवसायों को प्रतिशत दर्शाया गया है। ...
Text Solution
|
- चित्र में दिया गया वृत्त चार्ट मई -जून 2013 के दौरान वाहनों का केन्...
Text Solution
|
- चित्र में दिया गया वृत्त चार्ट मई -जून 2013 के दौरान वाहनों का केन्...
Text Solution
|
- चलों पाई चार्ट बनाना सीखें
Text Solution
|
- Study the following pie chart and table to answer the question.Total n...
Text Solution
|
- Study the following pie chart and table to answer the question.Total n...
Text Solution
|
- The given pie chart shows runs scored by A in 6 matches. दिया गया पा...
Text Solution
|
- The given pie-chart depicts the percentage of students coming to schoo...
Text Solution
|
- The given pie-chart, shows the percentage distribution of the expendit...
Text Solution
|