


Similar Questions
Explore conceptually related problems
Recommended Questions
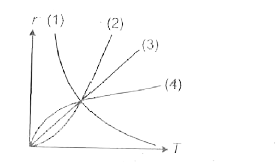
- Which graph best represents the variation of radius r of a circular...
Text Solution
|
- The period of a satellite in a circular orbit of radius R is T, the pe...
Text Solution
|
- The time period of a satellite in a circular orbit of radius R is T. T...
Text Solution
|
- Which graph best represents the variation of radius r of a circular or...
Text Solution
|
- The time period of a satellite in a circular orbit of radius R is T. T...
Text Solution
|
- If the time period of a satellite in the orbit of radius r around a pl...
Text Solution
|
- Which of the following graph represents the motion of a satellite revo...
Text Solution
|
- A satellite is in a circular orbit around a planet . Its period of rev...
Text Solution
|
- The period of a satellite in circular orbit of radius R is T. The peri...
Text Solution
|