


Similar Questions
Explore conceptually related problems
Recommended Questions
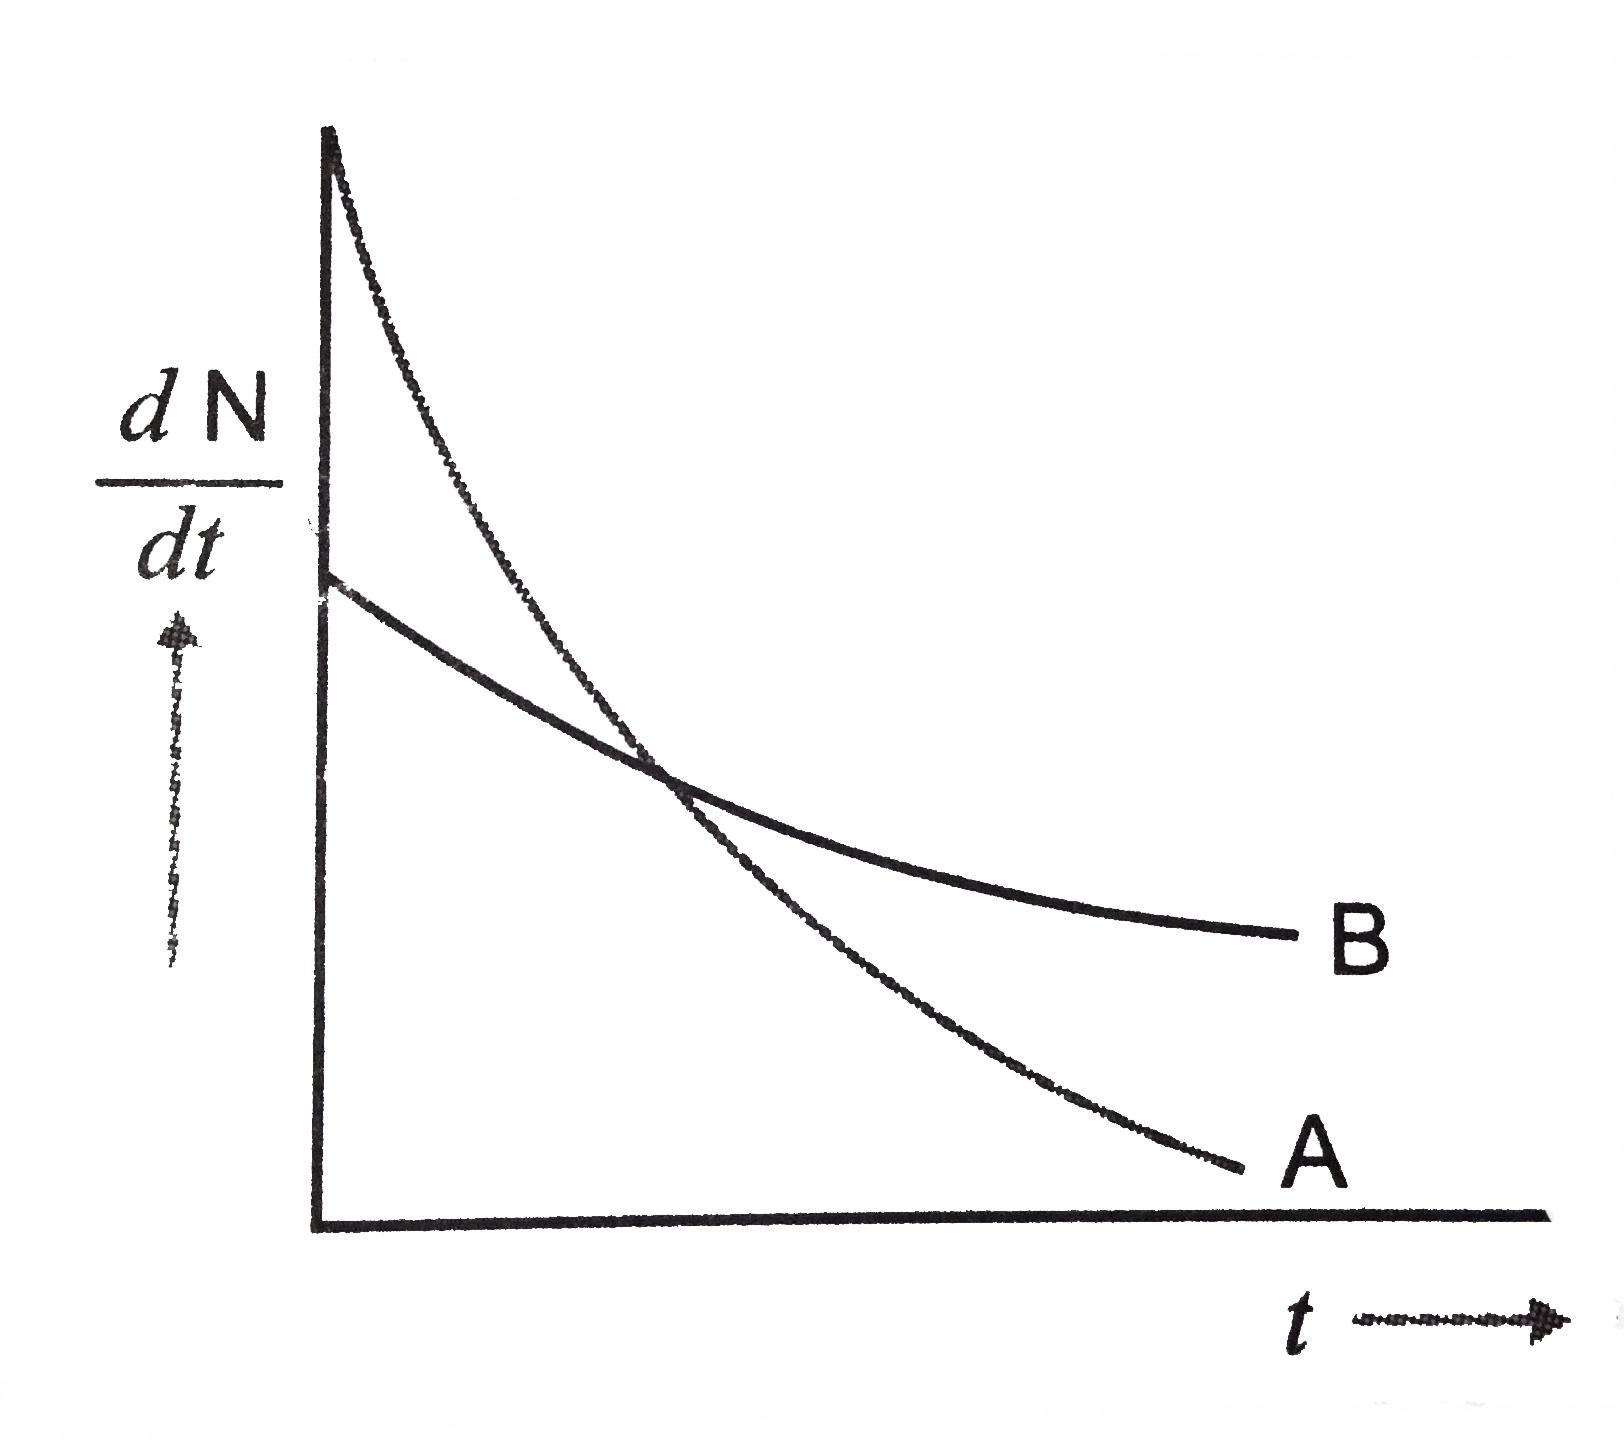
- The variation of decay rate of two radioactive samples A and B with ti...
Text Solution
|
- Samples of two radioactive nuclides A and B are taken. lambda(A) and l...
Text Solution
|
- The variation of decay rate of two radioactive samples A and B with ti...
Text Solution
|
- The rate of decay (R ) of nuclei in a radioactive sample is plotted ag...
Text Solution
|
- Sample of two radioactive nuclides A and B are taken. lambda(A) and la...
Text Solution
|
- The decay constant lambda of the radioactive sample is probaility of d...
Text Solution
|
- Consider the decay of P to A and B by two parallel first order reactio...
Text Solution
|
- The rate of decay (R ) of nuclei in a radioactive sample is plotted ag...
Text Solution
|
- A radioactive sample decays to form a stable nuclide. A graph showing ...
Text Solution
|