


Similar Questions
Explore conceptually related problems
Recommended Questions
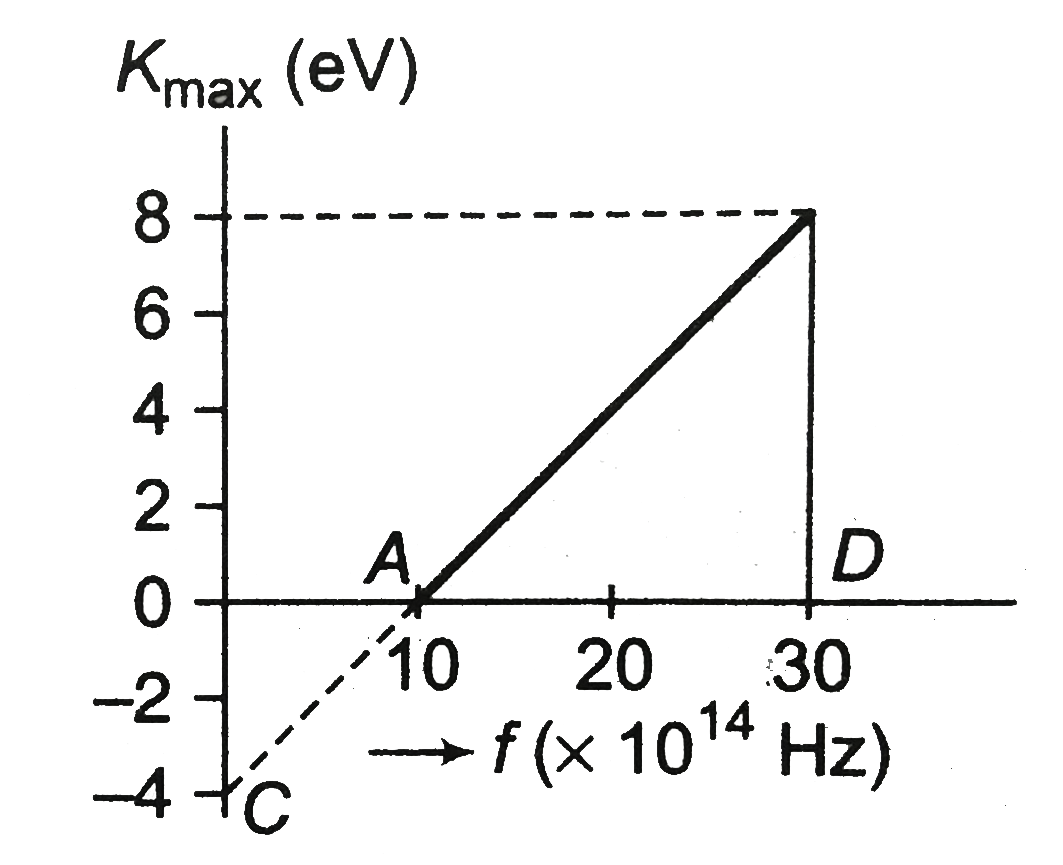
- A graph regarding photoelectric effect is shown between the maximum k...
Text Solution
|
- A graph regarding photoelectric effect is shown between the maximum k...
Text Solution
|
- प्रकाशवैधुत प्रभाव में आपतित प्रकाश की आवृत्ति और उत्सर्जित इलेक्...
Text Solution
|
- प्रकाशवैधुत प्रभाव के प्रयोग में उत्सर्जित फोटो - इलेक्ट्रॉन की अ...
Text Solution
|
- For a photoelectric experiment graph between kinetic energy of fastest...
Text Solution
|
- Draw a graph to show the dependence of stopping potential on the frequ...
Text Solution
|
- The photoelectric threshold frequency of a metal is v. When light of f...
Text Solution
|
- चित्र में प्रकाश - वैद्युत प्रभाव में उत्सर्जित फोटो इलेक्ट्रॉनों की अ...
Text Solution
|
- Graph between stopping potential and frequency of light as shown find ...
Text Solution
|